Extracting Gyroscope Allan Deviation Asymptotes and Noise Parameters
Extracting Allan deviation noise parameters demands fitting logarithmic asymptote slopes across discrete cluster time intervals under steady thermal conditions.
Slope
Logarithmic plots of two-sample variance show distinct power spectral density regimes across integration time scales. Allan deviation converts complex time-domain rate instabilities into straight lines on a log-log axis. By evaluating variance as a function of cluster duration tau, test engineers isolate specific noise processes that corrupt rate gyro readings over operational lifetimes.
Each stochastic mechanism carries a characteristic power spectral density exponent alpha, mapping to a unique slope on the Allan deviation curve. Quantization error, angle random walk, bias instability, rate random walk, and rate ramp form the standard noise model for both MEMS and optical gyroscopes.
Quantization error dominates short cluster spans.
When continuous physical rotation is converted into discrete digital words within an analog-to-digital converter or pulse-counting circuit, round-off truncation introduces high-frequency uncertainty. On a log plot, quantization noise manifests as a slope of negative one. As the averaging window tau expands, this noise diminishes rapidly, giving way to the broadband thermal and thermomechanical noise sources that set the instrument’s resolution limit.
Stochastic Noise Components in Optical and MEMS Gyroscopes
Sensor outputs exhibit time-varying instability driven by physical transduction mechanisms inside the sensing element. In MEMS vibratory gyroscopes, thermo-mechanical Brownian motion of the proof mass generates white rate noise; in fiber optic gyroscopes, shot noise at the optical detector produces the identical mathematical signature. Angle random walk describes this uncorrelated white rate noise, appearing as a negative half slope on the log-log plot, and serves as the primary parameter for calculating high-frequency error accumulation in strapdown navigation algorithms.
Flicker noise creates the flat floor.
At intermediate cluster times, the Allan deviation curve flattens into a horizontal plateau with a slope of zero. This region identifies bias instability, driven by flicker noise in sensor electronics, ambient thermal fluctuations, and structural strain relaxation in quartz or silicon flexures. The minimum value of the deviation curve defines the fundamental bias stability limit.
Averaging data beyond this optimal tau duration yields no further precision gains, as long-term systemic drifts take over.
| Noise Process | Log-Log Slope | Tau Dependency | Extracted Parameter | Standard Units |
|---|---|---|---|---|
| Quantization Noise | -1 | tau^-1 | Q (Quantization Noise) | arcsec or rad |
| Angle Random Walk | -0.5 | tau^-0.5 | N (Angle Random Walk) | deg/rt-hr |
| Bias Instability | 0 | tau^0 | B (Bias Instability) | deg/hr |
| Rate Random Walk | +0.5 | tau^+0.5 | K (Rate Random Walk) | deg/hr/rt-hr |
| Rate Ramp | +1 | tau^+1 | R (Rate Ramp) | deg/hr^2 |
Longer cluster durations bring low-frequency non-stationary processes into view. Rate random walk appears as a positive half slope on the logarithmic axis, driven by environmental temperature gradients, aging optical sources, and mechanical stress relaxation in module housings. Exponential temperature shifts and continuous structural warping generate rate ramps, plotting at a slope of positive one.
Extracting accurate asymptote lines requires long enough sampling runs to separate these low-frequency drift processes from the mid-span bias floor.
Angle random walk values taken at room temperature degrade by a factor of 1.8 when thermal control loops cycle across a 40-degree operational envelope.

Logarithmic Asymptotes and Correlation Time Scales
Linear asymptotes drawn tangentially to the Allan deviation curve isolate individual noise processes. The underlying model assumes that total variance equals the sum in quadrature of independent noise variance components. Isolating parameters requires identifying specific evaluation points along the cluster time axis where individual asymptotes intersect predefined reference lines.
Slope lines must be fitted across valid sub-regions.
Extracting parameters from mixed noise environments demands rigorous regional fitting rather than single-point measurements. If a single noise process dominates over a given tau interval, the local curve matches the theoretical slope precisely. In real-world data, overlapping noise signatures curve the log trace, forcing analysis algorithms to apply weighted regional regression to untangle coupled coefficients.
- Quantization Noise specifies high-frequency digital truncation error, extracted at a cluster duration of tau equals three square roots of two seconds along the negative one asymptote.
- Angle Random Walk defines white noise spectral density, evaluated directly at tau equals one second along the negative half asymptote line.
- Bias Instability identifies the minimum achievable rate uncertainty, calculated from the zero-slope curve floor divided by the constant factor of 0.664.
- Rate Random Walk measures random drift acceleration, extracted at tau equals three seconds along the positive half asymptote.
- Rate Ramp quantifies linear deterministic drift over extended operational periods, evaluated at tau equals the square root of two seconds along the positive one slope.
Misidentifying rate random walk as pure bias instability leads designers to set aggressive Kalman filter bias resets, injecting synthetic high-frequency noise directly into position updates.

Filter
Raw angular velocity time series from digital rate sensors carry high-frequency structural resonances and transient outliers that skew two-sample variance calculations. Pre-processing sensor data is a mandatory step prior to running Allan deviation algorithms. Unfiltered rate spikes generate artificial noise asymptotes, converting a single dropped digital packet into an apparent rate random walk tail on log-log plots.
Phase integrals smooth raw rate readings.
Allan variance calculations operate on phase or angle sequence data rather than raw rate samples. Integrating angular velocity over time produces an accumulated angle vector that stabilizes the numerical derivatives embedded in two-sample variance equations. Converting rate arrays to angle arrays eliminates high-frequency sampling jitter and ensures numerical stability across multi-million sample data streams.
Pre-Processing Operations and Outlier Suppression
Data cleaning removes unphysical spikes generated by host interface frame drops or mechanical shock events. A single outlier five standard deviations away from the mean distorts cluster variance values across two decades of tau durations. Filtering algorithms scan continuous rate files using sliding window median operators to identify and replace corrupted samples while preserving phase continuity.
Data gaps destroy spectral continuity.
Continuous static data logging requires uninterrupted sample clock timing. Missing data frames alter the effective sample interval tau-zero, invalidating the statistical independence assumptions of the Allan variance estimator. When data acquisition systems drop frames, linear interpolation creates artificial high-frequency smoothing, erroneously suppressing the calculated quantization noise asymptote.
- Record continuous static rate data at full output data rate without time gaps for a duration equal to at least 100 times the maximum target integration interval.
- Inspect the raw time series for phase discontinuities, lost frames, or quantization clipping using automated threshold masks.
- Remove deterministic dynamic offsets and linear thermal ramps from the angular velocity signal prior to computing phase integrals.
- Form the integrated rate sequence by cumulative summation multiplied by the uniform sampling interval.
- Compute overlapping two-sample variance vectors across logarithmic octave strides to maximize statistical confidence at long cluster lengths.
Short time-series collections understate long-term rate random walk while inflating confidence in bias instability calculations.
Overlapping Allan Variance Computation Efficiency
Standard Allan variance evaluates adjacent non-overlapping clusters, leaving significant time-series information unanalyzed. The standard two-sample variance divides N data samples into sub-arrays of length M, producing a limited number of independent cluster pairs. As tau increases, the number of available non-overlapping clusters drops rapidly, resulting in wide confidence intervals and high estimator variance at long integration times.
Overlapping estimators reduce variance uncertainty.
The overlapping Allan variance algorithm uses a sliding cluster structure that advances by a single sample stride rather than jumping full cluster lengths. This approach forms all possible overlapping pairs of duration tau from the time series dataset. The overlapping technique significantly increases the number of evaluated cluster pairs, sharpening statistical confidence without requiring longer static physical test runs.
Calculating overlapping Allan deviation requires significant computational memory for multi-day logs. Efficient software implementations utilize octave stride sampling along the tau axis, calculating variance values only at logarithmic increments. This logarithmic decimation prevents memory saturation while maintaining continuous asymptote tracking across five orders of magnitude in cluster duration.
Technical support notes from MEMS foundries frequently attribute mid-region variance bumps to ambient lab vibration, masking internal thermomechanical resonance.

Rig
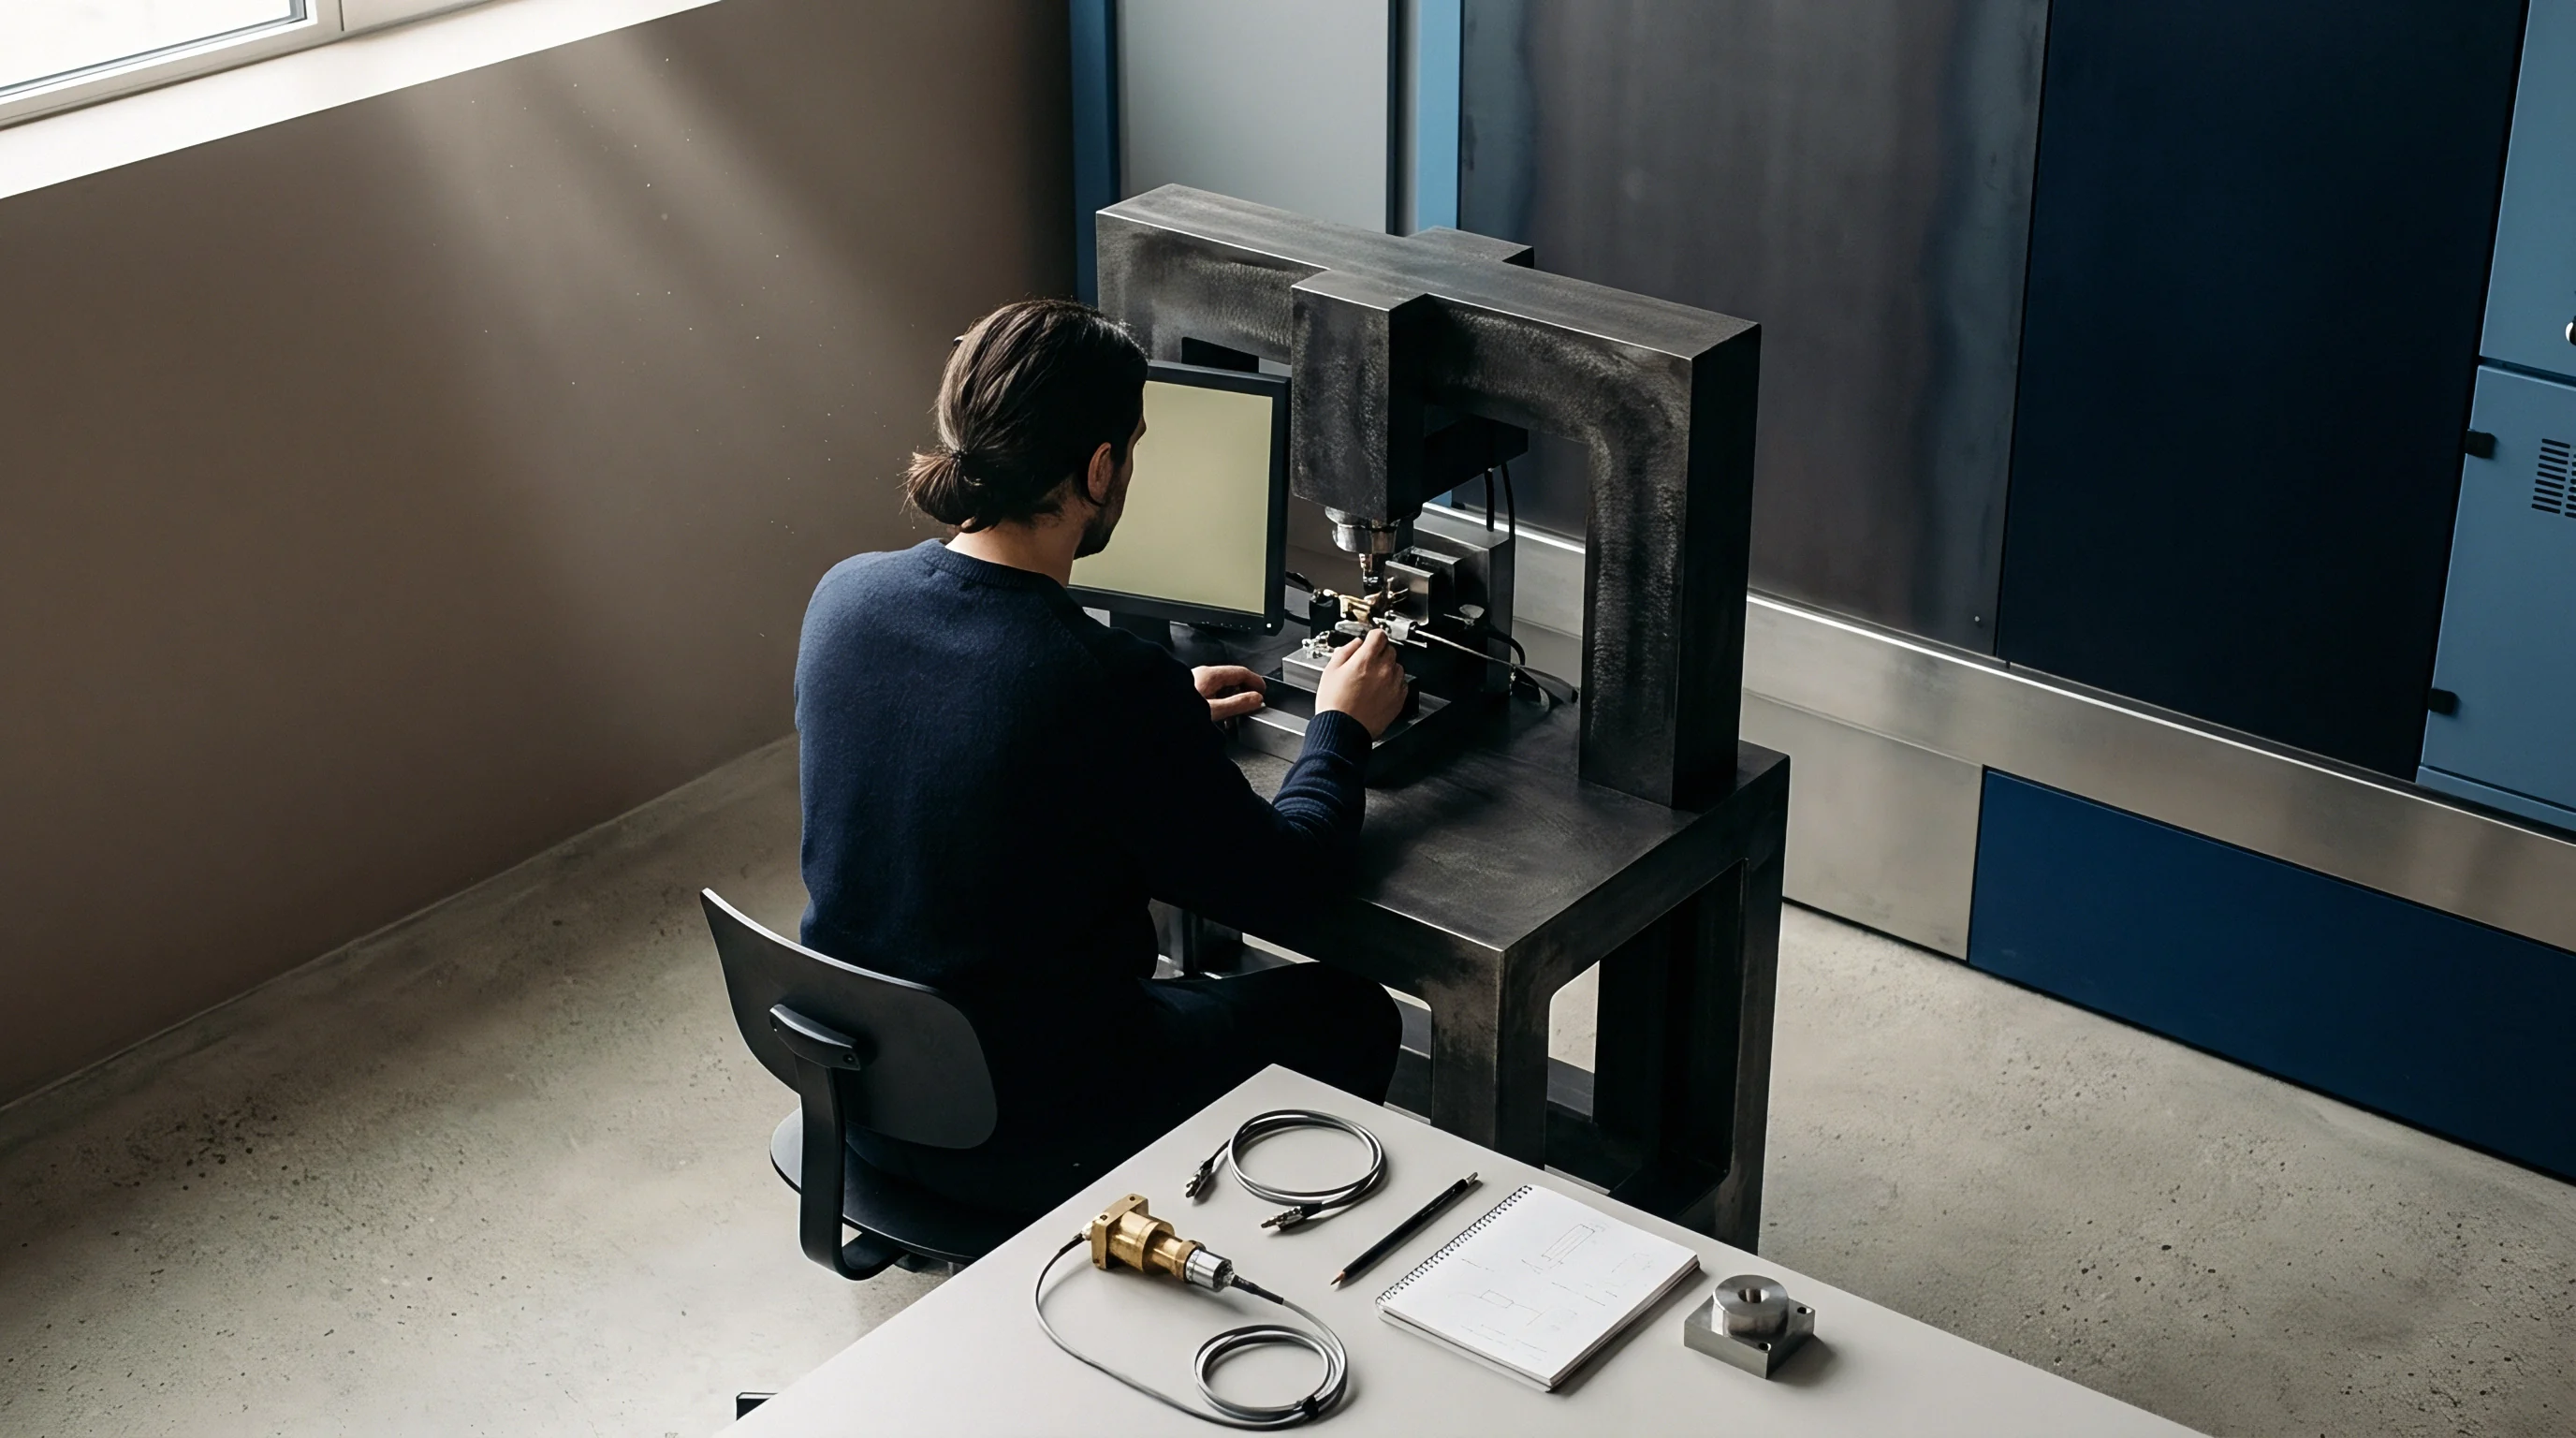
Static characterization demands absolute isolation from seismic vibrations, environmental acoustics, and thermal fluctuations that contaminate angular rate outputs. A sensor mounted on a flexible laboratory bench registers structural building sway as genuine rate input, creating false noise peaks near tau intervals corresponding to building structural resonance modes. Achieving repeatable parameter extraction requires an isolated physical testing platform.
Seismic tables eliminate foundation motion.
High-performance characterization utilizes granite optical tables suspended on active pneumatic vibration isolators. Pneumatic isolation attenuates ambient floor vibrations above three Hertz, preventing mechanical noise from corrupting the high-frequency angle random walk region. Mass loading the granite slab lowers the natural frequency of the mount, ensuring a stable physical frame during multi-day test runs.
Compliance with IEEE Std 952 section 8.2 dictates continuous temperature monitoring within 0.1 degrees Celsius to prevent thermal gradients from obscuring bias instability thresholds.
Why Do High Frequency Vibration Peaks Distort Allan Deviation Curves?
Harmonic disturbances generated by laboratory cooling fans and structural room motion leak directly into time-series integrals. Sinusoidal rate inputs create distinct humps on the Allan deviation log-log plot. These environmental artifacts overlay stochastic asymptotes, masking the true bias instability floor and causing regional regression algorithms to extract incorrect noise parameters.
Thermal gradients mimic rate random walk.
Temperature shifts distort log slopes.
Uncontrolled ambient temperature swings induce thermo-elastic expansion in sensing elements and drift in ASIC bias networks. An ambient thermal cycle of two degrees Celsius over a twelve-hour period presents as a false positive rate random walk asymptote. Valid characterization isolates the test article inside a temperature-controlled thermal chamber stabilized to within fractions of a degree Celsius over the full run duration.
- Granite Foundation provides massive structural damping to attenuate ambient low-frequency seismic ground vibrations during continuous static data runs.
- Thermal Enclosure maintains internal test chamber temperatures within 0.05 degrees Celsius per hour, suppressing environmentally induced bias drift.
- Power Conditioning supplies regulated low-noise direct current, preventing voltage ripple from injecting power supply hum into sensor digitizers.
- Magnetic Shielding surrounds sensitive optical and MEMS pickoff structures with high-permeability mu-metal enclosures to block external electromagnetic interference.
Annex B of IEEE Std 1554 explicitly specifies thermal chamber isolation, ensuring that temperature-induced rate drift remains below five percent of the intrinsic bias instability floor.
Arithmetic
Transforming graphic asymptote intercepts into engineering units requires explicit scaling factor transformations derived from cluster time evaluation points. Standardized testing documents, including IEEE Std 952 for fiber optic gyroscopes and IEEE Std 1554 for MEMS sensors, define exact numerical scale factors linking log-log curve intercepts directly to physical noise spectral densities.
Linear scaling converts graphical intercepts directly.
Angle random walk extraction illustrates this numeric transformation. On a log-log plot of Allan deviation sigma against cluster duration tau, the angle random walk asymptote follows a slope of negative one-half. Evaluating the fitted line at tau equals one second yields a numerical value sigma-one.
The angle random walk coefficient N equals sigma-one directly, expressed in degrees per square-root hour when the input rate array uses degrees per hour.
Conversion Equations for Standardized Sensor Parameter Scaling
Numerical relationships defined in industry testing standards link the fitted magnitude at specific cluster durations to standard parameters. Quantization noise Q isolates from the fitted negative-one slope line by reading the intercept at tau equals three square roots of two seconds. Bias instability B extracts from the flat zero-slope region by taking the minimum value sigma-min and dividing by the statistical scaling factor 0.664.
Uncalibrated thermal drift ruins navigation accuracy.
Rate random walk K isolates from the positive half slope line evaluated at tau equals three seconds. Rate ramp R derives from the positive one slope line read at tau equals the square root of two seconds. Applying these conversion constants directly normalizes raw graphical findings into standardized datasheet units suitable for strapdown error budget modeling.
| Sensor Technology | Angle Random Walk (deg/rt-hr) | Bias Instability (deg/hr) | Rate Random Walk (deg/hr/rt-hr) | Fit Correlation Confidence |
|---|---|---|---|---|
| Consumer MEMS Gyroscope | 0.150 | 12.500 | 1.200 | 0.912 |
| Industrial MEMS Gyroscope | 0.028 | 1.800 | 0.095 | 0.965 |
| Tactical MEMS Gyroscope | 0.005 | 0.150 | 0.008 | 0.988 |
| Tactical Fiber Optic Gyro | 0.001 | 0.020 | 0.001 | 0.994 |
| Data derived from 24-hour continuous static records logged at 100 Hz in a temperature-controlled chamber at 25 degrees Celsius under active vibration isolation. | ||||
Regional Weighted Least Squares Regression Formulas
Automated parameter fitting isolates logarithmic sub-regions where single noise mechanisms dominate the variance spectrum. Defining noise extraction as a linear regression problem in log-log space allows robust numerical optimization: the logarithm of the Allan deviation equation becomes a linear function of the logarithm of cluster time tau.
Weighting functions compensate for cluster count decay.
Because the statistical variance of Allan deviation estimates increases at longer tau durations due to fewer available cluster pairs, standard unweighted linear regression overemphasizes long-term data points. Weighted least squares regression applies a weighting factor proportional to the inverse variance of each Allan deviation estimate, protecting parameter fits against low-frequency sample noise at high tau values.
- Time Series Metadata records sample rate, total collection time, ambient chamber temperature logs, and hardware serial identifiers.
- Overlapping Deviation Array presents calculated tau vectors alongside corresponding overlapping Allan deviation and upper and lower statistical confidence limits.
- Asymptote Intercept Vector lists extracted numerical values for quantization noise, angle random walk, bias instability, rate random walk, and rate ramp.
- Uncertainty Variance Bounds provides calculated chi-squared confidence intervals based on the effective degrees of freedom at each evaluation point.
How precisely optimal weighting coefficients balance correlation between overlapping clusters in higher-order rate ramp extraction stays open to numerical debate among calibration engineers.
Margin
Sourcing specifications frequently conflate raw noise density with Allan deviation bias stability, leading to misaligned error budgets in inertial navigation systems. Procurement engineers reading sensor datasheets must distinguish between single-frequency rate noise density, typically quoted in degrees per second per square-root Hertz, and Allan deviation angle random walk, quoted in degrees per square-root hour. Converting between these domain units requires applying specific conversion factors rooted in underlying integration windows.
Datasheet claims require bench verification.
Component manufacturers regularly present Allan deviation curves generated under highly idealized laboratory conditions. A factory datasheet curve may reflect a short four-hour test run performed inside a heavy magnetic and thermal shield. When deployed on a dense industrial circuit board adjacent to switching power supplies and high-power processors, that identical sensor element displays elevated bias instability and significant rate random walk tails.
Datasheet Ambiguities and Testing Verification Gaps
Manufacturer parameter summary tables often quote best-case laboratory measurements without detailing the underlying cluster span. A bias instability claim of 0.1 degrees per hour appears attractive on a component specification sheet. However, if that minimum occurs at a cluster time tau of 10,000 seconds inside a thermal bath, the sensor cannot achieve that performance level in a real-time system requiring ten-second sensor updates.
Commercial gyroscopes specified on short four-hour runs show significant drift acceleration during continuous multi-day missions.
Bias drift limits open-loop estimation.
Evaluating the ratio between angle random walk and bias instability defines the operational integration horizon for strapdown attitude estimation. Sensors exhibiting high angle random walk rapidly accumulate orientation variance during short-duration dynamic maneuvers. Sensors with poor bias instability drift out of bounds during long-duration dead-reckoning spans.
Qualification testing must verify both parameters across the complete expected operational thermal band.

Commercial Qualification and Landed Cost Implications
Procurement decisions based on incomplete noise specifications introduce costly redesign cycles during system integration. Selecting a MEMS gyro element solely on low unit cost frequently backfires when incoming inspection reveals wide batch-to-batch variation in angle random walk asymptotes. Screening component lots using automated twenty-four-hour static Allan deviation trials establishes true yield distributions before parts land on assembly lines.
Higher sample rates lower quantization noise.
Cross-qualifying alternative gyroscope vendors requires verifying that replacement components match not only the headline bias instability number, but also the asymptote crossover points. If an alternative component exhibits identical bias instability but an angle random walk four times higher than the primary part, existing Kalman filter tuning parameters fail, generating heading drift failures in production units.
Evaluating sensors against continuous long-term static logs provides a clearer defense against thermal drift failures than accepting short datasheet summary tables.