Incoming Transducer Inspection Basic Verification Workflow Setup
A structured transducer intake bench verifies zero balance, insulation resistance, and multi-point span accuracy against calibrated reference standards.


Dock
Receiving shipments of precision sensors demands immediate physical evaluation before parts move into warehouse storage. Transducers arriving from overseas factories endure unpredictable vibration, drop impacts, and ambient temperature swings during transit. Physical inspection establishes whether structural elements retain factory mechanical tolerances before any electrical power reaches internal bridge circuits.
Transit stress often compromises delicate pressure diaphragms, internal strain gauge bonds, and hermetic connector seals long before electrical testing reveals operational failure.
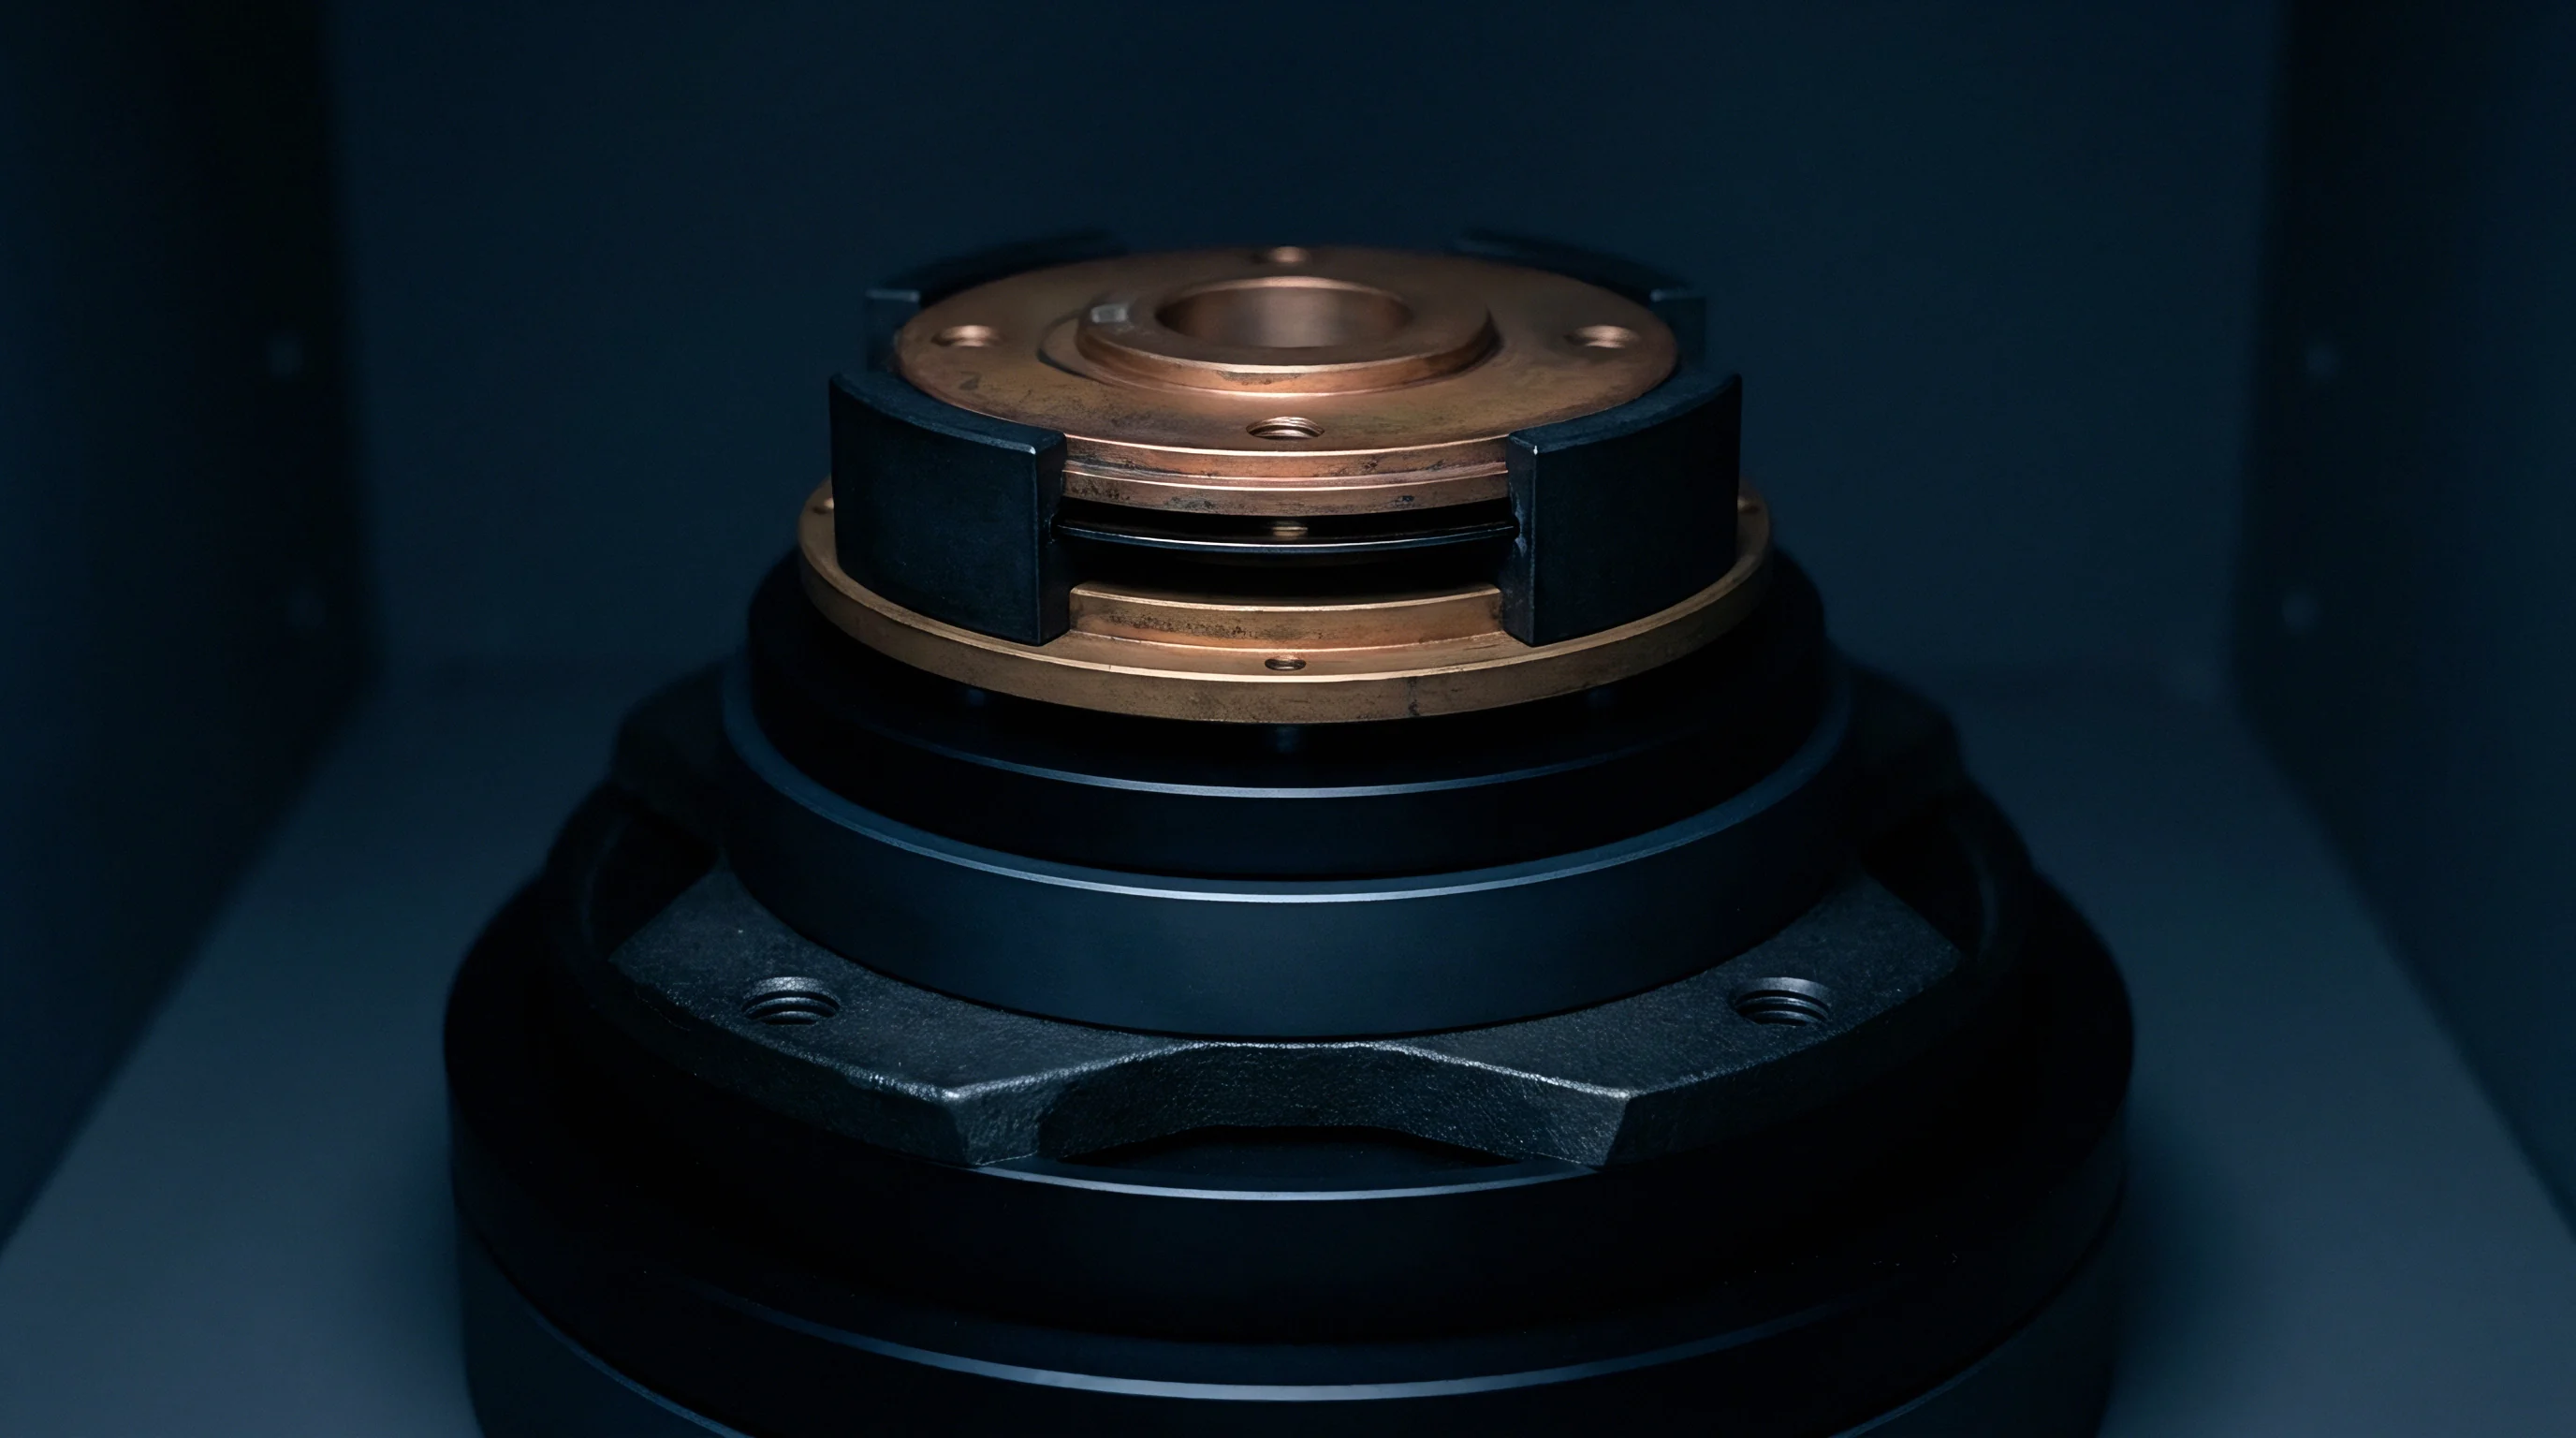
Receiving Protocol and Package Condition
Transporters frequently subject crate contents to mechanical shock during air freight handling. Receiving personnel must examine secondary packaging for crushing, puncture marks, or moisture staining. Impact indicators affixed to external shipping containers provide quantifiable evidence of excessive force during handling.
The whole lot fails.
- Hermetic Seal Breach Moisture ingress into internal sensor cavities causes pin-to-case leakage currents and shifts zero balance voltage over short operating durations.
- Thread Profile Distortion Damaged port threads prevent proper torque application, generating artificial strain fields inside pressure sensor bodies during installation.
- Pin Array Bending Deformed electrical connector pins cause contact resistance changes, skewing sensitive excitation lines during bench verification.
- Diaphragm Surface Scratches Particulate impact on thin sensing diaphragms induces localized stress concentrations, degrading long-term linearity performance.

Visual Inspection and Housing Integrity
Microscopic surface cracks around weld seams allow airborne contaminants to reach internal sensing elements over extended storage cycles. High-magnification optical inspection under low-angle illumination reveals hairline fractures in stainless steel housings and laser weld fillets. Threaded pressure ports demand thread pitch gauge verification to confirm compliance with NPT or UNF machining specifications.
Improper torque deforms sensor housings.
Static discharge through ungrounded sensor pins destroys thin-film strain elements before physical bench testing begins.
Dimensional checks using calibrated digital micrometers confirm that housing diameters, port depth, and mounting flange dimensions meet engineering drawing tolerances. A variance exceeding 50 micrometers on mounting shoulder geometry introduces mechanical pre-load during system installation. Static discharge ruins piezoresistive bridges.
Bypassing incoming physical checks routes damaged sensor housings onto assembly lines, where micro-cracks propagate under operating pressure and trigger field returns that cost ten times the original unit price.


Excitation
Powering ratiometric strain gauge bridges demands stable DC power sources with minimal output ripple. Electrical baseline verification confirms that internal bridge resistance, insulation isolation, and current draw conform to manufacturing datasheets. Applying unconditioned power to high-sensitivity transducers masks internal component defects while introducing artificial noise into zero balance measurements.

Electrical Continuity and Isolation Resistance Testing
Galvanic isolation between internal signal leads and external stainless housings protects sensitive amplification circuits from stray ground loops. Measurement of insulation resistance requires a regulated direct current megohmmeter operating at 50 volts DC. The test probes connect simultaneously across shorted input/output pins and the exposed outer casing.
Moisture intrusion shifts baseline resistance.
| Sensor Architecture | Excitation Voltage Range | Isolation Resistance Target | Maximum Allowable Bridge Imbalance |
|---|---|---|---|
| Piezoresistive Strain Gauge | 5 to 10 VDC | Greater than 100 Megohms at 50 VDC | 1.5 percent Full Scale |
| Variable Capacitance | 12 to 24 VDC | Greater than 500 Megohms at 100 VDC | 0.5 percent Full Scale |
| Linear Variable Differential Transformer | 3 to 5 VRMS at 2.5 kHz | Greater than 50 Megohms at 50 VDC | 1.0 percent Full Scale |
| Piezoelectric Charge Transducer | 18 to 30 VDC (IEPE) | Greater than 1000 Megohms at 100 VDC | 2.0 percent Full Scale |

Power Source Stability and Sense Line Connections
Voltage drops across lengthy bench wiring introduce systematic amplitude errors into raw millivolt transducer outputs. Utilizing four-wire or six-wire Kelvin sense configurations eliminates line resistance influences by feeding voltage feedback directly to the excitation source regulators. Shield grounding prevents signal noise.
Unanchored sense wires degrade accuracy.
- Connect the transducer lead wires to an isolated, low-noise DC power supply set to the specified excitation voltage.
- Measure insulation resistance between pin tie-points and the outer metal housing using a 50 volt direct current megohmmeter.
- Record the quiescent zero-load signal output after a two-minute electrical stabilization period.
- Verify six-wire sense line feedback loops to confirm automatic compensation for ambient lead wire resistance shifts.
An unconditioned power supply with 5 millivolts of ripple induces a 0.12 percent full-scale measurement error in unamplified ratiometric bridge transducers at 23 degrees Celsius.
Dirty power skews zero readings. Manufacturers frequently attribute zero-point drift in delivered units to customer power supply fluctuations rather than incomplete factory burn-in.


Fixture
Precision load cells and pressure transducers change calibration curves when mounted incorrectly on test benches. Mechanical verification setups must isolate transducers from external frame bending, thermal room currents, and mounting torque variations. Poor clamping geometry shifts output span figures independently of sensor electrical performance.

Mechanical Alignment and Mounting Torque Controls
Thread engagement depth alters internal strain distribution across sensing housings during high-pressure installation. Calibrated torque wrenches ensure uniform clamping force during intake testing. Applying excessive mounting torque distorts internal diaphragm supports, generating artificial zero offsets that mimic thermal drift.
Loose clamps ruin measurement repeatability.
- Torque Tool Calibration Certified torque drivers prevent over-tightening sensor ports, avoiding permanent offset shifts in piezoresistive diaphragms.
- Thread Lubricant Selection Anti-seize compounds with consistent friction coefficients reduce off-axis assembly stresses during port engagement.
- Side Load Elimination Flexible alignment couplings prevent eccentric forces from skewing axial force measurements on precision load cells.
- Sealing Interface Selection Metal crush washers require extreme compression forces that transmit bending moments into transducer housings.

Thermal Equilibration in the Test Bench Environment
Temperature differences between cold shipping containers and climate-controlled laboratory rooms shift zero balance outputs. Transducers require sufficient soak time to reach thermal equilibrium with ambient laboratory air before starting verification sweeps. Thermal equilibrium requires patience.
Cold oil shifts mechanical response.
Temperature stabilization requires a minimum resting period of four hours inside the testing bay for every twenty degrees Celsius of thermal delta from transit conditions.
Mounting hardware stiffness matches or exceeds the structural rigidity of the transducer housing to prevent parasitic strain absorption during calibration checks.


Span
Multi-point calibration procedures evaluate transducer transfer functions across specified operating pressure ranges. Generating reference loads using deadweight testers or automated pressure controllers allows precise mapping of output voltage against applied standard pressure. Verification workflows apply static pressures across ascending and descending load cycles to quantify linearity, hysteresis, and repeatability metrics.

Multi Point Linearity and Hysteresis Assessment
Ascending and descending load steps expose mechanical friction and internal hysteresis within diaphragm structures. A standard five-point calibration sweep applies loads at 0, 25, 50, 75, and 100 percent of full-scale output capacity. Comparing output signals at identical intermediate load points during rising and falling pressure steps reveals internal mechanical energy dissipation.
Calibration drift compounds over time.
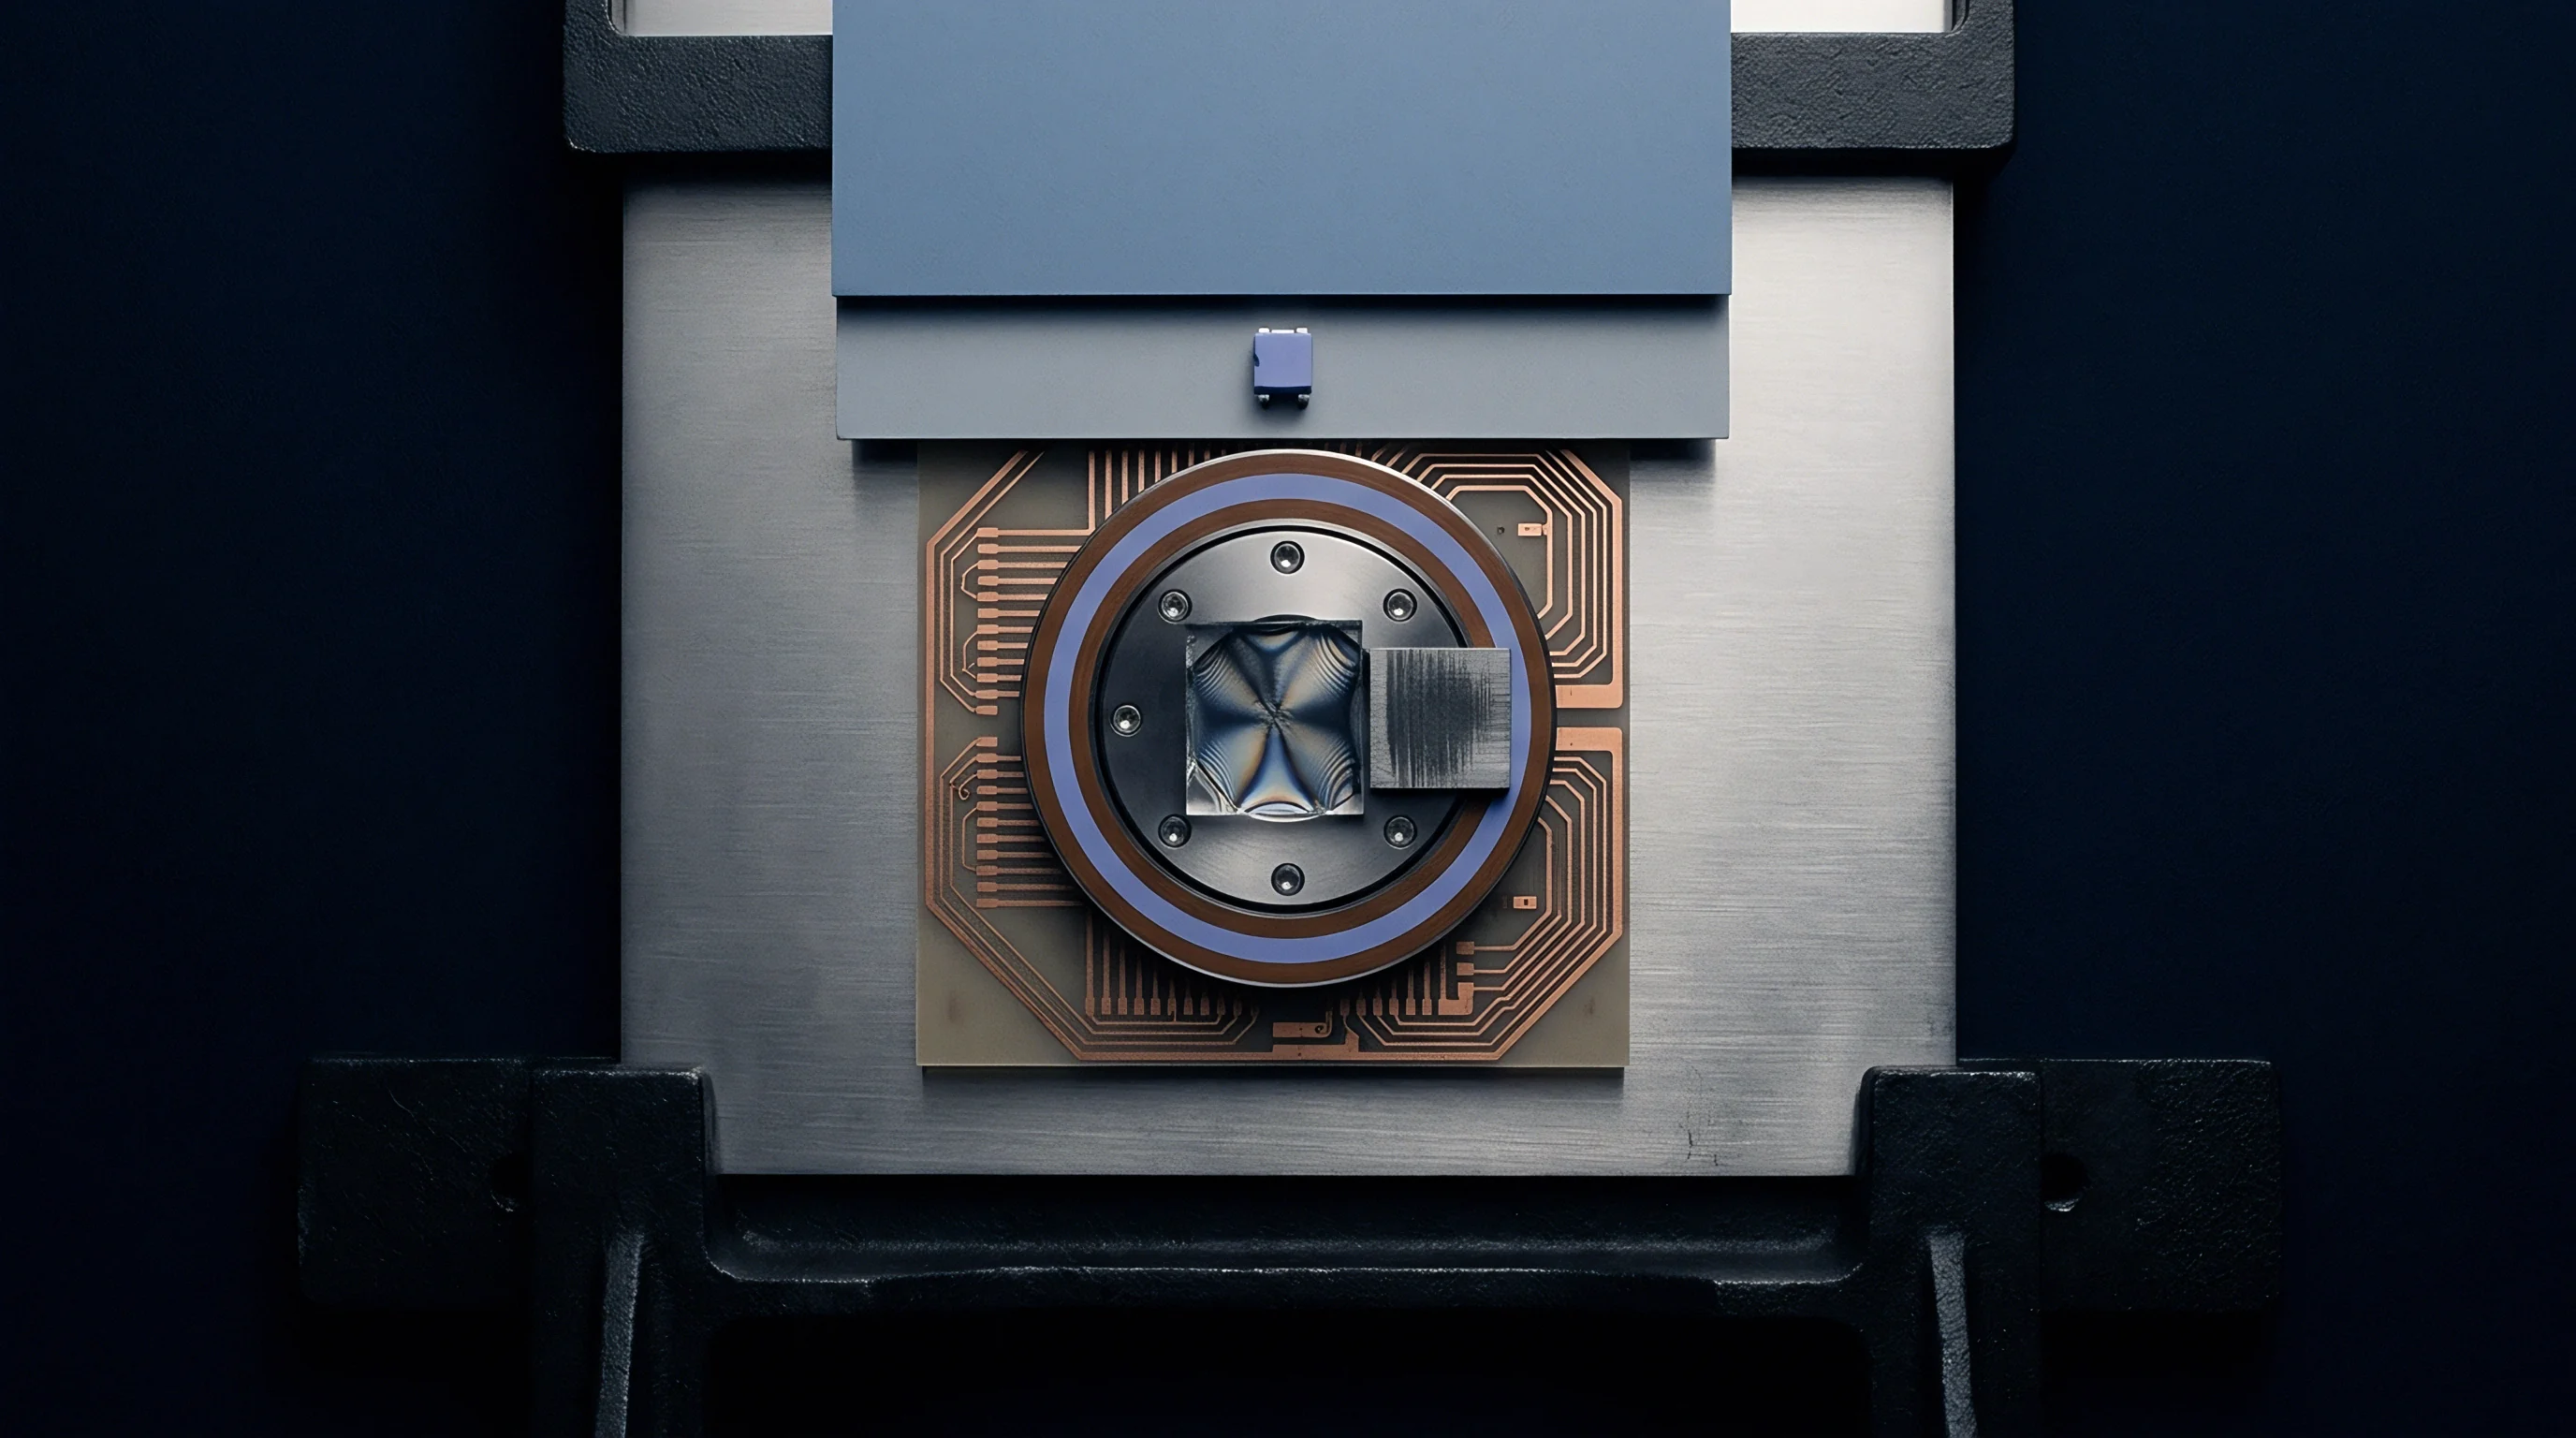
Where Do Sensor Non Linearity Drift Errors Originate?
Uncompensated expansion in internal sensing elements skews measurement outputs across broad operational temperature bands. Strain gauge adhesives undergo micro-creep under continuous mechanical stress, resulting in baseline offset migration. Material inhomogeneities inside metal diaphragms yield non-linear deflection curves under applied pressure profiles.
Assume a receiving batch of 50 piezoresistive pressure transducers rated at 100 bar full scale, carrying a supplier tolerance specification of 0.25 percent full scale, equivalent to +/-0.25 bar maximum error. The intake laboratory utilizes a reference deadweight tester with an expanded uncertainty of 0.02 bar at a coverage factor of k = 2. During multi-point verification at 0, 20, 40, 60, 80, and 100 percent of full scale, unit number 14 exhibits an ascending output of 50.12 bar at 50 percent load, but a descending output of 50.48 bar at the same point.
The resulting hysteresis gap of 0.36 bar exceeds the maximum total error budget of 0.25 bar. The inspector flags unit number 14 for rejection, expanding sampling to the full batch lot.
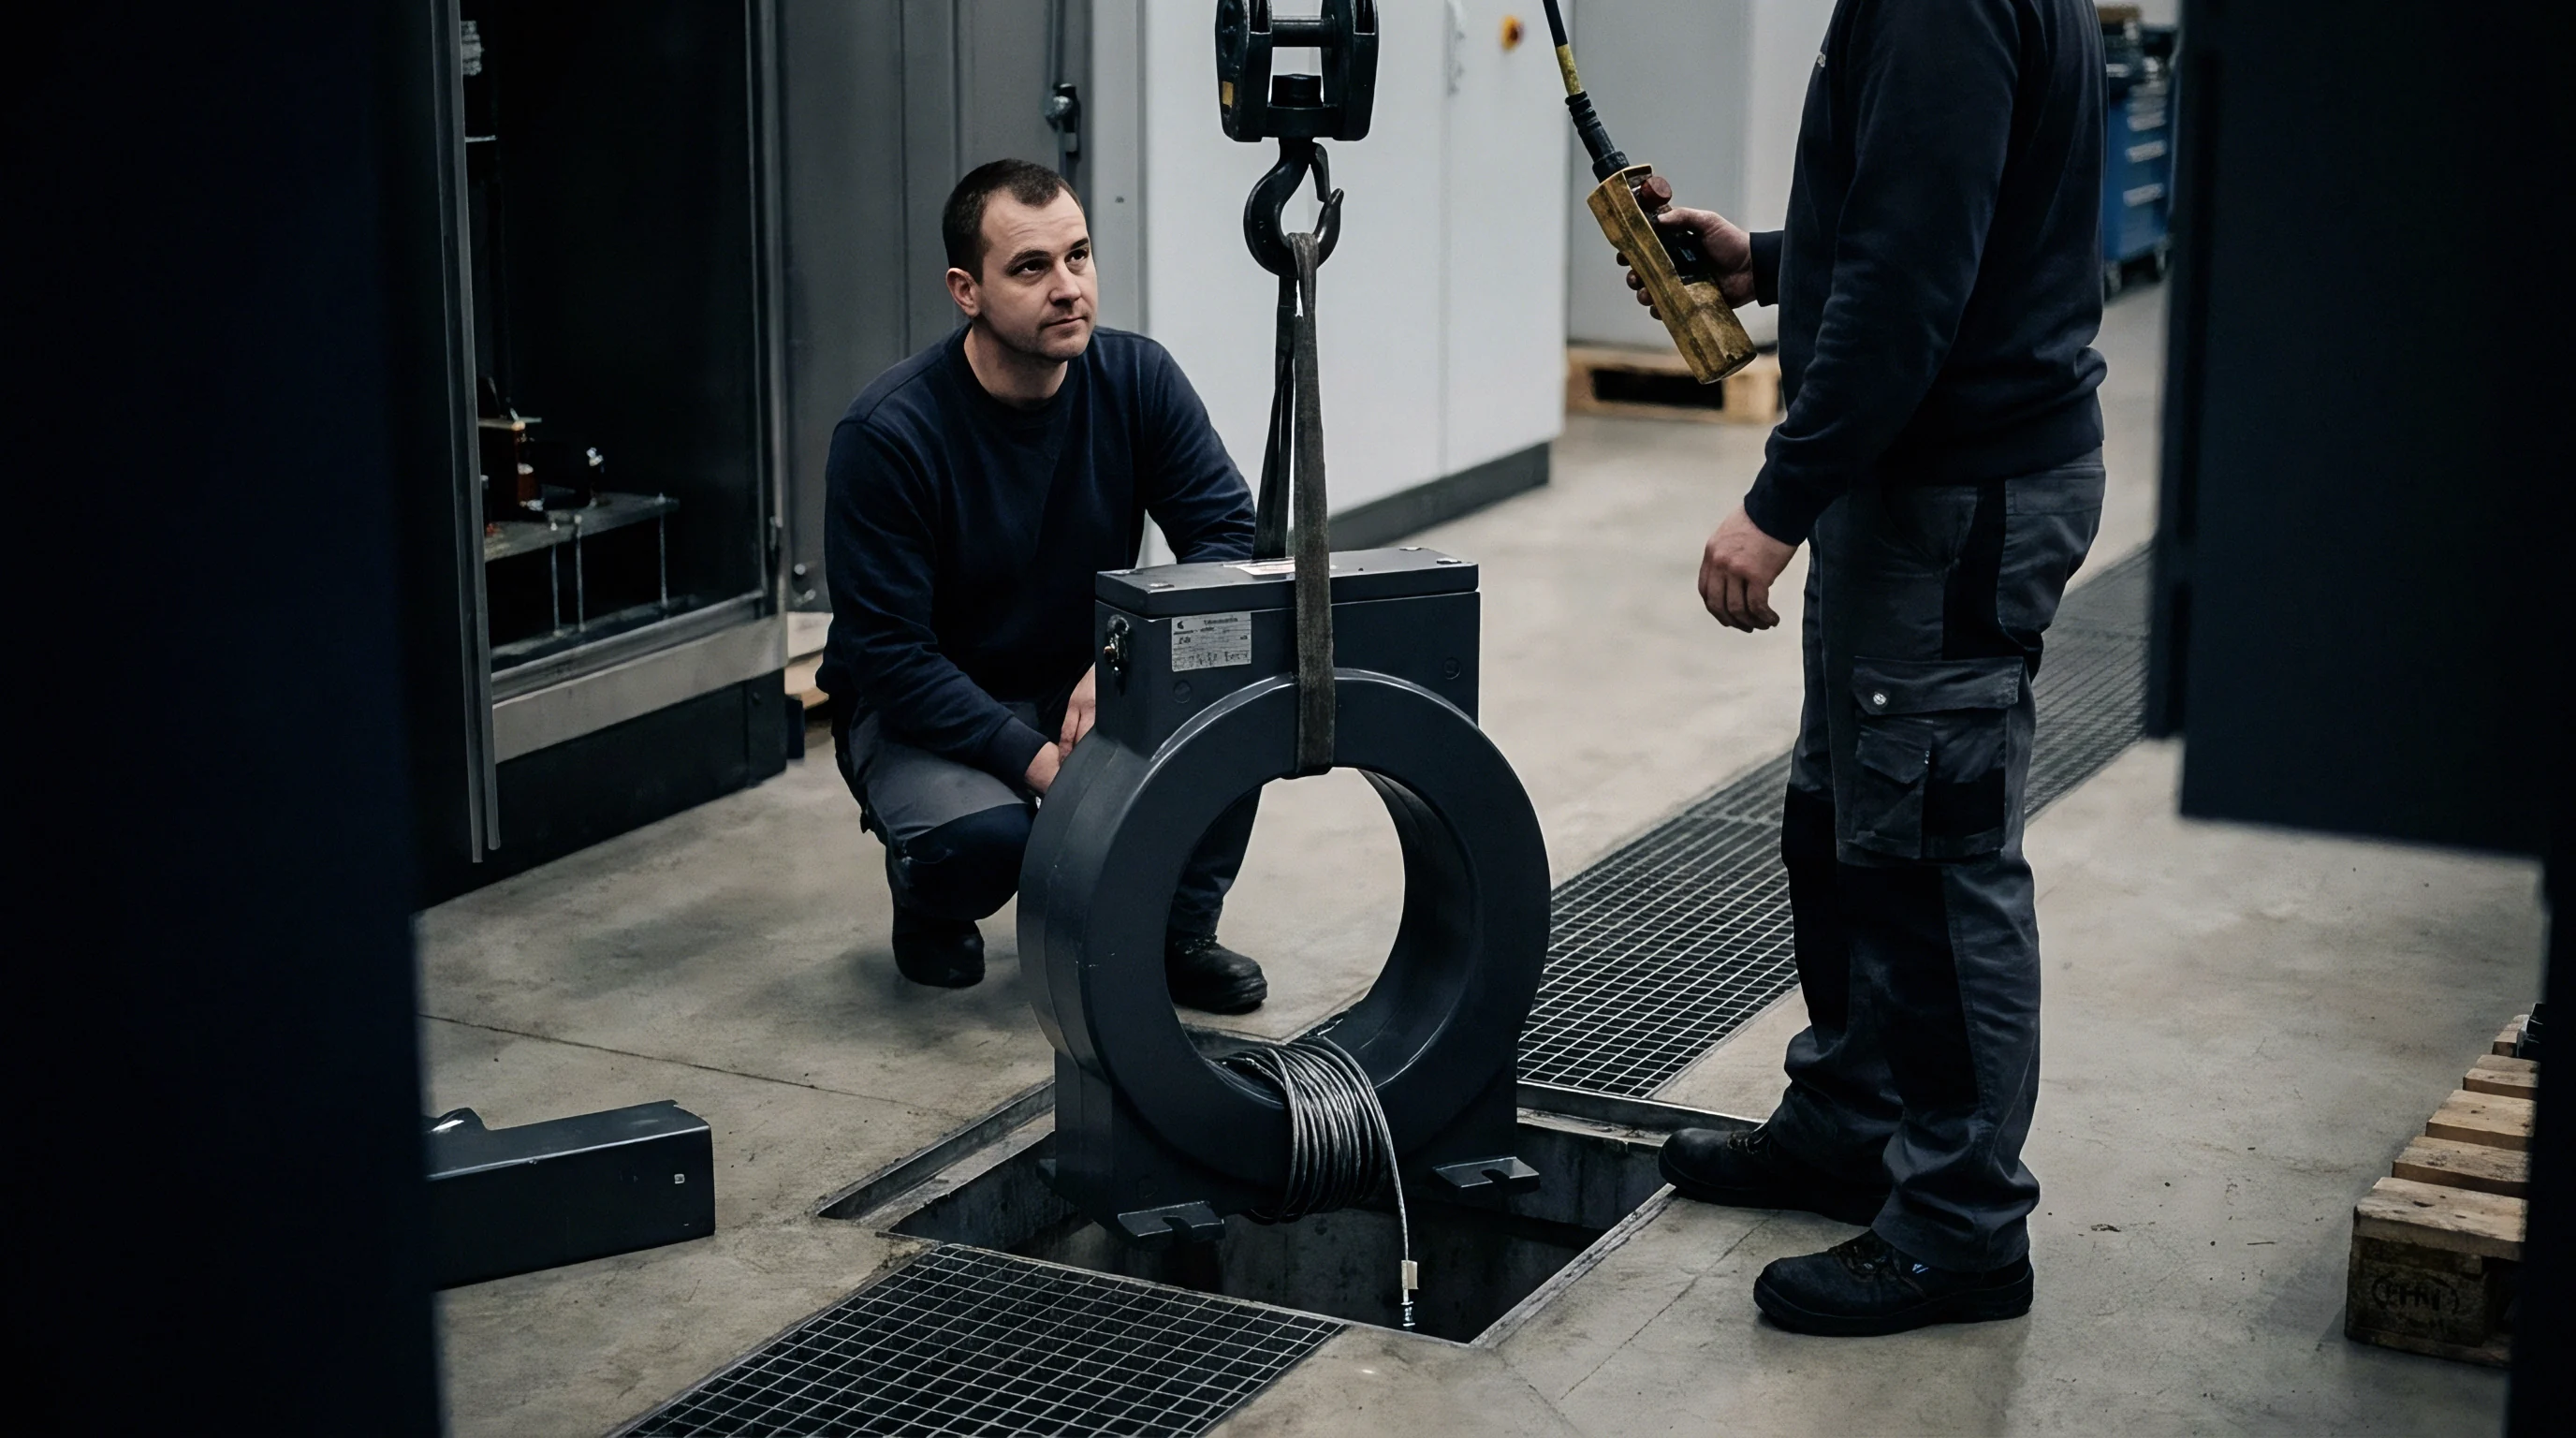
Zero Offset Wander and Full Scale Calibration Check
Tare shifts recorded before applying calibration weights indicate residual structural stress or internal bridge relaxation. Zero drift indicates strain relaxation. Uncertified reference standards invalidate tests.
| Calibration Point (% FS) | Target Input (bar) | Acceptable Signal Band (mV/V) | Reference Standard Uncertainty (bar) | Combined Uncertainty Budget (bar) |
|---|---|---|---|---|
| 0 percent | 0.00 | 0.000 +/- 0.005 | 0.002 | 0.006 |
| 25 percent | 25.00 | 2.500 +/- 0.012 | 0.005 | 0.014 |
| 50 percent | 50.00 | 5.000 +/- 0.012 | 0.010 | 0.018 |
| 75 percent | 75.00 | 7.500 +/- 0.012 | 0.015 | 0.022 |
| 100 percent | 100.00 | 10.000 +/- 0.005 | 0.020 | 0.025 |
| Combined uncertainty calculated according to JCGM 100 guidelines using root-sum-square aggregation of reference standard uncertainty, environmental variation, and bench repeatability. | ||||
Clause 7.8.2 of ISO/IEC 17025 explicitly mandates that unaccredited calibration documentation lacking reported measurement uncertainty invalidates batch acceptance claims during quality audits.
Section 6.2 of ISO 10012 specifies that measurement equipment showing non-linear errors above allowable limits shall be segregated and labeled immediately to prevent unauthorized production use.


Dossier
Documentation attached to sensor deliveries contains critical metrics that confirm instrument origin and traceability. Auditing factory calibration certificates against laboratory test data reveals discrepancies between vendor claims and bench reality. Complete quality documentation forms the legal foundation for warranty claims and regulatory audit defense.
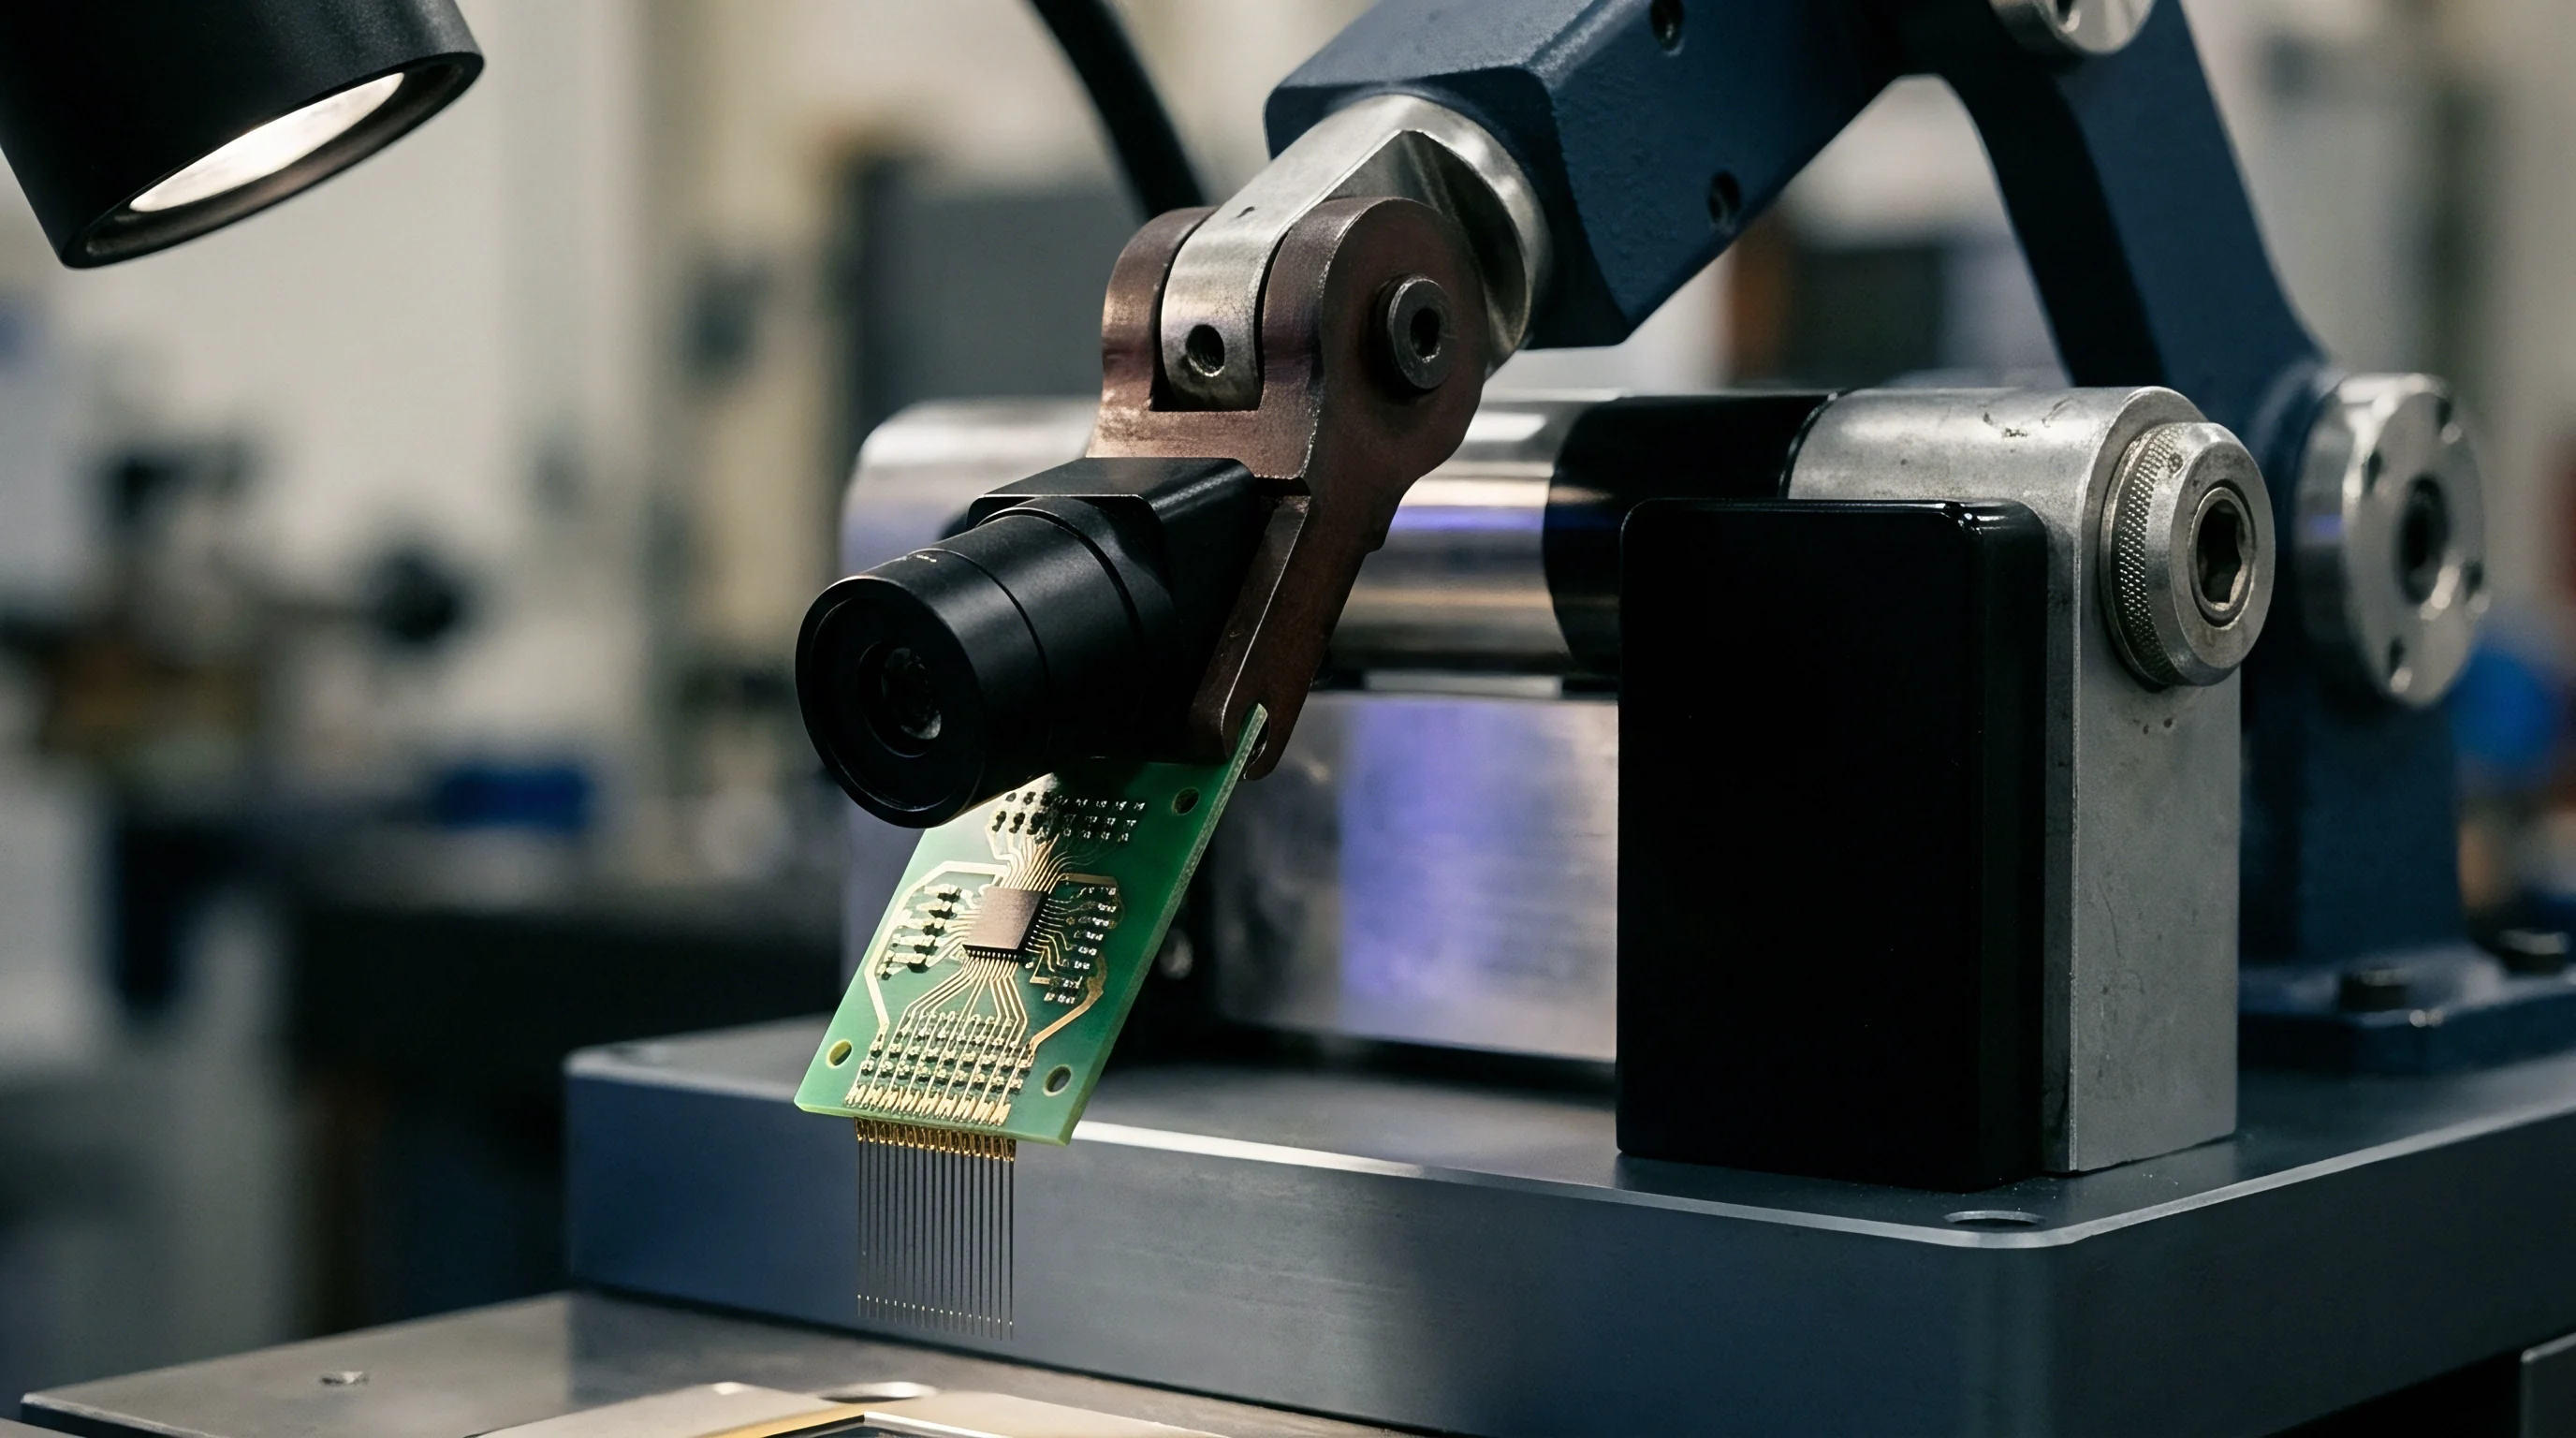
Calibration Certificate Audit and Traceability Verification
Laboratory accreditation records provided by vendor testing facilities include coverage factors and uncertainty estimates. Reviewing calibration documentation requires checking national metrology institute traceability chains, accreditation body scope symbols, and calibration date stamps. Incomplete certs halt assembly lines.
Batch sampling catches latent defects.
| Intake Discrepancy | Identified Metrological Defect | Production Line Exposure | Mandatory Disposition Action |
|---|---|---|---|
| Missing Uncertainty Statement | Uncalibrated reference standard used by vendor | Undetected systemic measurement offset | Quarantine batch pending vendor certificate revision |
| Zero Offset > 1% FS | Internal bridge resistor drift or mechanical shock | Premature sensor saturation in service | Reject lot and initiate vendor corrective action |
| Hysteresis Loop Asymmetry | Diaphragm micro-cracking or internal friction | Non-repeatable process feedback loops | Return unit for tear-down analysis |
| Isolation Resistance | Moisture ingress or damaged pin insulation | Ground loop interferences and signal drift | Scrap unit and revise packaging seal specifications |

Batch Acceptance Criteria and Sampling Statistics
Statistical sampling rules establish whether incoming sensor shipments enter manufacturing lines or return to vendors. Applying acceptance sampling standards like ANSI/ASQ Z1.4 (ISO 2859-1) defines sample sizes based on lot size and acceptable quality limits. Identifying a single critical non-conformity during verification triggers 100 percent screening of the remaining shipment at supplier expense.
An incoming transducer verification bench recovers its initial hardware investment within three batch intakes by catching supplier drift errors prior to system integration.
Establishing structured intake verification workflows transforms incoming transducer handling from a passive receiving task into a rigorous quality control barrier. Quality teams that log zero drift figures and hysteresis spreads build complete lot dossier records, giving engineering teams precise metrological data to hold suppliers accountable and protect downstream system performance.