Constructing Cryogenic Thermal Shift Master Curves for Structural Epoxy Adhesives under Dynamic Temperature Ramps
Dynamic temperature shifts in cryogenic structural epoxy master curves demand non-isothermal rate correction factors to resolve physical aging relaxation delays.

Equivalence

Validity Limits of Time Temperature Superposition
Standard protocols build viscoelastic master curves by applying time-temperature superposition to isothermal frequency sweeps. In step testing, a polymer specimen dwells at discrete thermal plateaus until structural equilibrium settles before mechanical oscillation sweeps across a target frequency band. Structural epoxies exposed to cryogenic environments below their glass transition undergo physical changes that challenge horizontal translation principles.
Below 150 K, polymer chain segments freeze into fixed structural configurations. Isothermal spectra measured at cold plateaus miss the structural evolution that occurs when an adhesive joint cools dynamically in service.
Dynamic mechanical analysis under steady cooling ramps exposes a continuous shift in relaxation times. Above 1 K/min cooling rates, backbone structural recovery lags behind the thermal trajectory. The material falls out of thermodynamic equilibrium, locking in excess free volume and unrelaxed internal stresses.
Building a single master curve with standard Williams-Landel-Ferry shift factors from equilibrium isotherms severely underestimates modulus at sub-ambient temperatures. Shift factors lose horizontal additivity across the glassy transition because the physical structure changes continuously with cooling rate.
Standard time-temperature superposition models fail when structural relaxation rates lag behind continuous laboratory cooling speeds.

Thermorheological Complexity across Vitrification Bounds
Thermorheologically simple materials show identical temperature dependence across all relaxation mechanisms, so a single horizontal shift factor aligns both storage and loss modulus spectra. Densely crosslinked epoxies break this simplicity when cooled toward cryogenic limits. Primary alpha relaxations tied to glass transition vitrification freeze out, but localized secondary beta and gamma relaxations stay active down to liquid nitrogen temperatures.
Because these mechanisms have different activation energies, the low-temperature modulus tail shifts at a different rate than the primary glass transition spectrum.
Quantifying this complexity requires comparing shift factors from storage modulus alignment against those derived from loss modulus peak alignment. Isothermal tests often mask this divergence because of instrument settling times at each dwell step. Dynamic ramp testing reveals the split clearly, as continuous cooling forces different relaxation modes into simultaneous non-equilibrium transitions.
Master curves that do not separate backbone vitrification from localized side-group relaxations overestimate energy dissipation during rapid cryogenic transients.
| Test Parameter | Isothermal Step Method | Dynamic Temperature Ramp |
|---|---|---|
| Thermal Equilibrium State | Equilibrium established at dwell steps | Non-equilibrium structural relaxation state |
| Test Execution Time | 8 to 14 hours per specimen | 1.5 to 3 hours per specimen |
| Shift Factor Additivity | Strict additivity holds above Tg | Additivity breaks due to structural hysteresis |
| Secondary Relaxation Capture | Discreter steps miss narrow loss peaks | Continuous resolution across sub-Tg transitions |
| Instrument Compliance Drift | Corrected via static dwell calibration | Requires real-time thermal expansion tracking |
Cryogenic joint debonding is frequently attributed to micro-void inclusion or surface preparation defects when static isothermal datasheets fail to predict dynamic ramp stiffness.
Chill

Free Volume Collapse and Physical Aging
Cooling a structural epoxy from room ambient down to cryogenic temperatures sharply reduces unoccupied space between polymer chains. Liquid nitrogen immersion or gaseous helium chilling drives fractional free volume below critical thresholds, arresting long-range molecular motion. During a continuous dynamic cooling ramp, rapid cooling prevents molecular networks from reaching equilibrium density.
The epoxy enters a non-equilibrium glassy regime where structural relaxation continues over operational time scales ~ a process known as physical aging.
Physical aging changes the mechanical response as a function of thermal history and elapsed time at cryogenic temperatures. As the polymer matrix contracts toward equilibrium, yield stress rises while ultimate tensile elongation drops. Dynamic master curves built from transient ramps must isolate thermal contraction from time-dependent structural relaxation; failing to separate physical aging dynamics yields invalid predictions of crack propagation thresholds and impact resistance in cryogenic bonds.
- Thermal expansion mismatch strain induces high localized shear stress along rigid metal substrate interfaces during continuous cooling ramps.
- Sub-Tg structural embrittlement reduces fracture toughness when secondary molecular relaxations freeze out below 120 K.
- Transient internal stress build occurs when non-uniform temperature gradients develop across thick bond lines.
- Free volume trapping maintains elevated enthalpy states that release localized heat during subsequent micro-yielding events.

Non Equilibrium Glassy States under Transient Cooling
The thermal history of a structural adhesive layer determines its glassy state and density at 77 K. Fast chilling shifts the effective glass transition temperature upward, trapping higher free volume than slow cooling. This non-equilibrium state alters the material’s apparent activation energy, making time-temperature shift factors explicitly dependent on cooling rate. Dynamic mechanical analyzer data collected during a 5 K/min cooling ramp yields a stiffer response than data gathered during a 0.5 K/min ramp at identical temperatures.
Measuring this shift rate dependency demands rigorous control over sample thermal mass and heat transfer. Aluminum or titanium dummy substrates inside the test chamber provide local temperature sensing directly at the bond line. Extrapolating glassy modulus data without accounting for cooling-rate-induced density variances introduces systematic errors into finite element stress models for space payload structures or superconducting magnet supports.
A cooling rate increase from 0.5 K/min to 5 K/min shifts the apparent vitrification temperature upward by 4.2 K in bisphenol-A epoxy systems.
Rapid thermal transitions lock excess energy into the molecular network, making cryogenic modulus stability dependent on the specific cooling path.

Ramp

Non Isothermal Shift Factor Formulations
Building valid cryogenic master curves requires modified shift factor models that include cooling rate alongside absolute temperature. Standard Williams-Landel-Ferry expressions apply exclusively above the glass transition temperature under equilibrium conditions. Below Tg, modified Arrhenius formulations use the Tool-Narayanaswamy-Moynihan phenomenological model, dividing the temperature dependence of relaxation times into an explicit thermal term and a structural state term governed by effective fictive temperature.
The total horizontal shift factor combines equilibrium thermal acceleration with non-equilibrium structural recovery kinetics. Under a dynamic cooling rate dotT, the governing relation for the horizontal shift factor aT takes the structural form:
ln aT(T, Tf) = fracx Δ HR left( frac1T – frac1Tref right) + frac(1-x) Δ HR left( frac1Tf – frac1Tref right)
Here, Δ H represents activation energy for structural relaxation, x is the non-linearity parameter between zero and one, R is the universal gas constant, and Tf is the fictive temperature tracking non-equilibrium structural state evolution during the cooling ramp.

Density and Temperature Dependent Vertical Corrections
Horizontal translation alone cannot align loss spectra measured across dynamic temperature sweeps. Thermal expansion and density changes alter the concentration of entropy-elastic network chains per unit volume. Vertical shift factors bT correct raw modulus magnitudes before horizontal shifting takes place, accounting for density and temperature changes through the relationship:
bT(T) = fracρ(Tref) · Trefρ(T) · T
Where ρ(T) is the temperature-dependent density of the cured epoxy matrix. At cryogenic temperatures, density increases non-linearly while thermal expansion coefficients drop toward zero near 4 K. Neglecting vertical corrections undercounts low-temperature storage modulus by up to seven percent in densely filled structural adhesives.
- Run thermal expansion tests via dilatometry from 293 K down to 77 K to capture the non-linear density curve of the cured adhesive.
- Execute multi-frequency dynamic mechanical sweeps during a controlled 2 K/min cooling ramp, collecting storage and loss modulus spectra across 0.1 Hz to 100 Hz.
- Apply vertical shift factor corrections to raw storage and loss modulus curves to compensate for temperature-induced volume changes.
- Calculate the evolving fictive temperature profile across the cooling ramp using enthalpy relaxation data obtained from differential scanning calorimetry.
- Determine activation energy and non-linearity parameters by fitting vertical-corrected spectral data to the Tool-Narayanaswamy-Moynihan horizontal shift model.
- Superimpose corrected frequency sweeps horizontally against a chosen reference temperature to form the unified cryogenic viscoelastic master curve.
Applying standard isothermal shift values to dynamic cooling profiles overestimates stress relaxation capacity, under-predicting cryogenic interfacial shear stress and leading to unexpected joint failure.
Shift

Transducer Compliance and Thermal Lag Calibration
High-precision mechanical testing at cryogenic temperatures introduces significant compliance and thermal sensing errors. As the frame cools a specimen down to liquid nitrogen temperatures, the load cell, extension rods, and clamps stiffen. Raw displacement reported by the linear variable differential transformer includes elastic deformation of the testing rig itself.
Under high-modulus cryogenic conditions, machine compliance can account for up to forty percent of total measured sample strain.
Thermal lag between the controlling thermocouple and the internal core of the specimen distorts shift factors. During a 5 K/min cooling ramp, the center of a 3 mm thick adhesive specimen can lag chamber readings by up to 12 K. Calibrating thermal lag requires placing a fine-wire type T thermocouple directly inside a calibration dummy. Real-time temperature correction offset tables then align mechanical data points with actual specimen temperature rather than chamber setpoints.
ASTM E1640 mandates compliance calibration across the full operational temperature envelope to prevent instrument frame deflection from corrupting measured glass transition loss peaks.
How Do Dynamic Temperature Rates Alter Shift Factor Calibration?
Varying the thermal ramp rate alters both the magnitude and slope of horizontal shift curves across the sub-ambient regime. Faster ramp rates reduce the time available for structural relaxation at a given temperature, artificially shifting the apparent glass transition upward. Calibration protocols must isolate true material viscoelastic response from rate-dependent thermal lag and non-equilibrium structural effects.
A thorough calibration matrix requires evaluating specimens across at least three distinct cooling rates combined with multi-frequency excitation. Comparing shift factor curves from different ramp rates exposes thermal lag when curves fail to converge after fictive temperature correction. Accurate master curve construction depends on eliminating instrument artifacts before solving for non-linear relaxation parameters.
| Uncertainty Source | Standard Uncertainty | Probability Distribution | Sensitivity Coefficient | Uncertainty Contribution |
|---|---|---|---|---|
| Specimen Core Thermal Lag | 1.8 K | Rectangular | 0.045 log(aT)/K | 0.081 log units |
| Frame Machine Compliance | 0.003 mm/kN | Normal | 12.4 MPa/mm | 0.037 GPa |
| Phase Angle Calibration | 0.08 degrees | Normal | 0.012 tan(delta)/deg | 0.001 tan delta |
| Specimen Dimension Tolerances | 0.015 mm | Rectangular | 1.85 GPa/mm | 0.028 GPa |
| Load Cell Thermal Drift | 0.45 N | Normal | 0.008 GPa/N | 0.004 GPa |
| Methods note: Combined expanded uncertainty calculated with coverage factor k=2, corresponding to a 95 percent confidence level under ISO/IEC Guide 98-3 guidelines. | ||||
The exact threshold where physical aging overshadows linear viscoelastic behavior during rapid cooling remains an open question in cryogenic structural polymer research.

Ductility
Secondary Relaxations and Sub Glassy Absorptions
Cryogenic ductility in structural epoxies relies almost entirely on localized secondary relaxations operating deep inside the glassy state. Primary alpha transitions freeze completely below 200 K, leaving the main polymer backbone rigid. Secondary beta relaxations, typically occurring between 170 K and 220 K, originate from localized motion of diphenylolpropane groups and glycidyl ether crosslink segments.
Gamma relaxations, which remain active down to 100 K, stem from aliphatic amine monomer motions and localized moisture complexing.
Master curves built from dynamic temperature ramps must resolve these secondary absorption peaks with high phase-angle sensitivity. Standard frequency sweeps conducted at coarse thermal steps often miss narrow beta relaxation bands entirely. Continuous cooling ramps capture these subtle damping peaks, allowing calculation of activation energies specific to sub-Tg ductile transitions.
Adhesives with prominent beta relaxation peaks retain superior impact resistance and thermal shock durability when chilled down to 77 K.
Secondary mechanical loss peaks below 180 K govern localized micro-yielding and prevent catastrophic brittle cleavage in cryogenic structural bonds.
Cryogenic Strain Rate Sensitivity
Sub-ambient mechanical behavior shows strong strain rate sensitivity as temperatures approach absolute zero. High strain rates limit the time available for localized secondary relaxations to dissipate energy. When an adhesive joint experiences rapid mechanical loading during dynamic cooling, ductility drops precipitously, triggering brittle cleavage failure.
Constructing master curves across a wide frequency spectrum permits conversion of frequency-dependent dynamic data into equivalent high-strain-rate time-domain properties. Conversion models use the equivalence between high excitation frequency and rapid loading rates. Correct calibration of cryogenic shift curves ensures accurate mapping of high-rate stress-strain responses, enabling reliable impact assessment for aerospace structures exposed to thermal shock and vibration.
- Verify dynamic mechanical analyzer force limits across the entire temperature span to prevent transducer saturation during high-stiffness sub-Tg sweeps.
- Confirm linear viscoelastic range boundaries by executing strain sweeps at the coldest target operational temperature prior to dynamic ramp testing.
- Incorporate vertical density factor corrections into loss factor calculations to avoid artificial broadening of secondary relaxation peaks.
- Validate shift factors against low-temperature crack lap shear tests conducted at matching dynamic cooling rates to ensure microstructural fidelity.
ISO 6721-11 clause 6.3 requires verifying linear viscoelastic boundaries at both temperature extremes to ensure strain amplitudes do not induce non-linear structural damage during master curve generation.
Valuation
Financial Exposure of Unverified Shift Master Curves
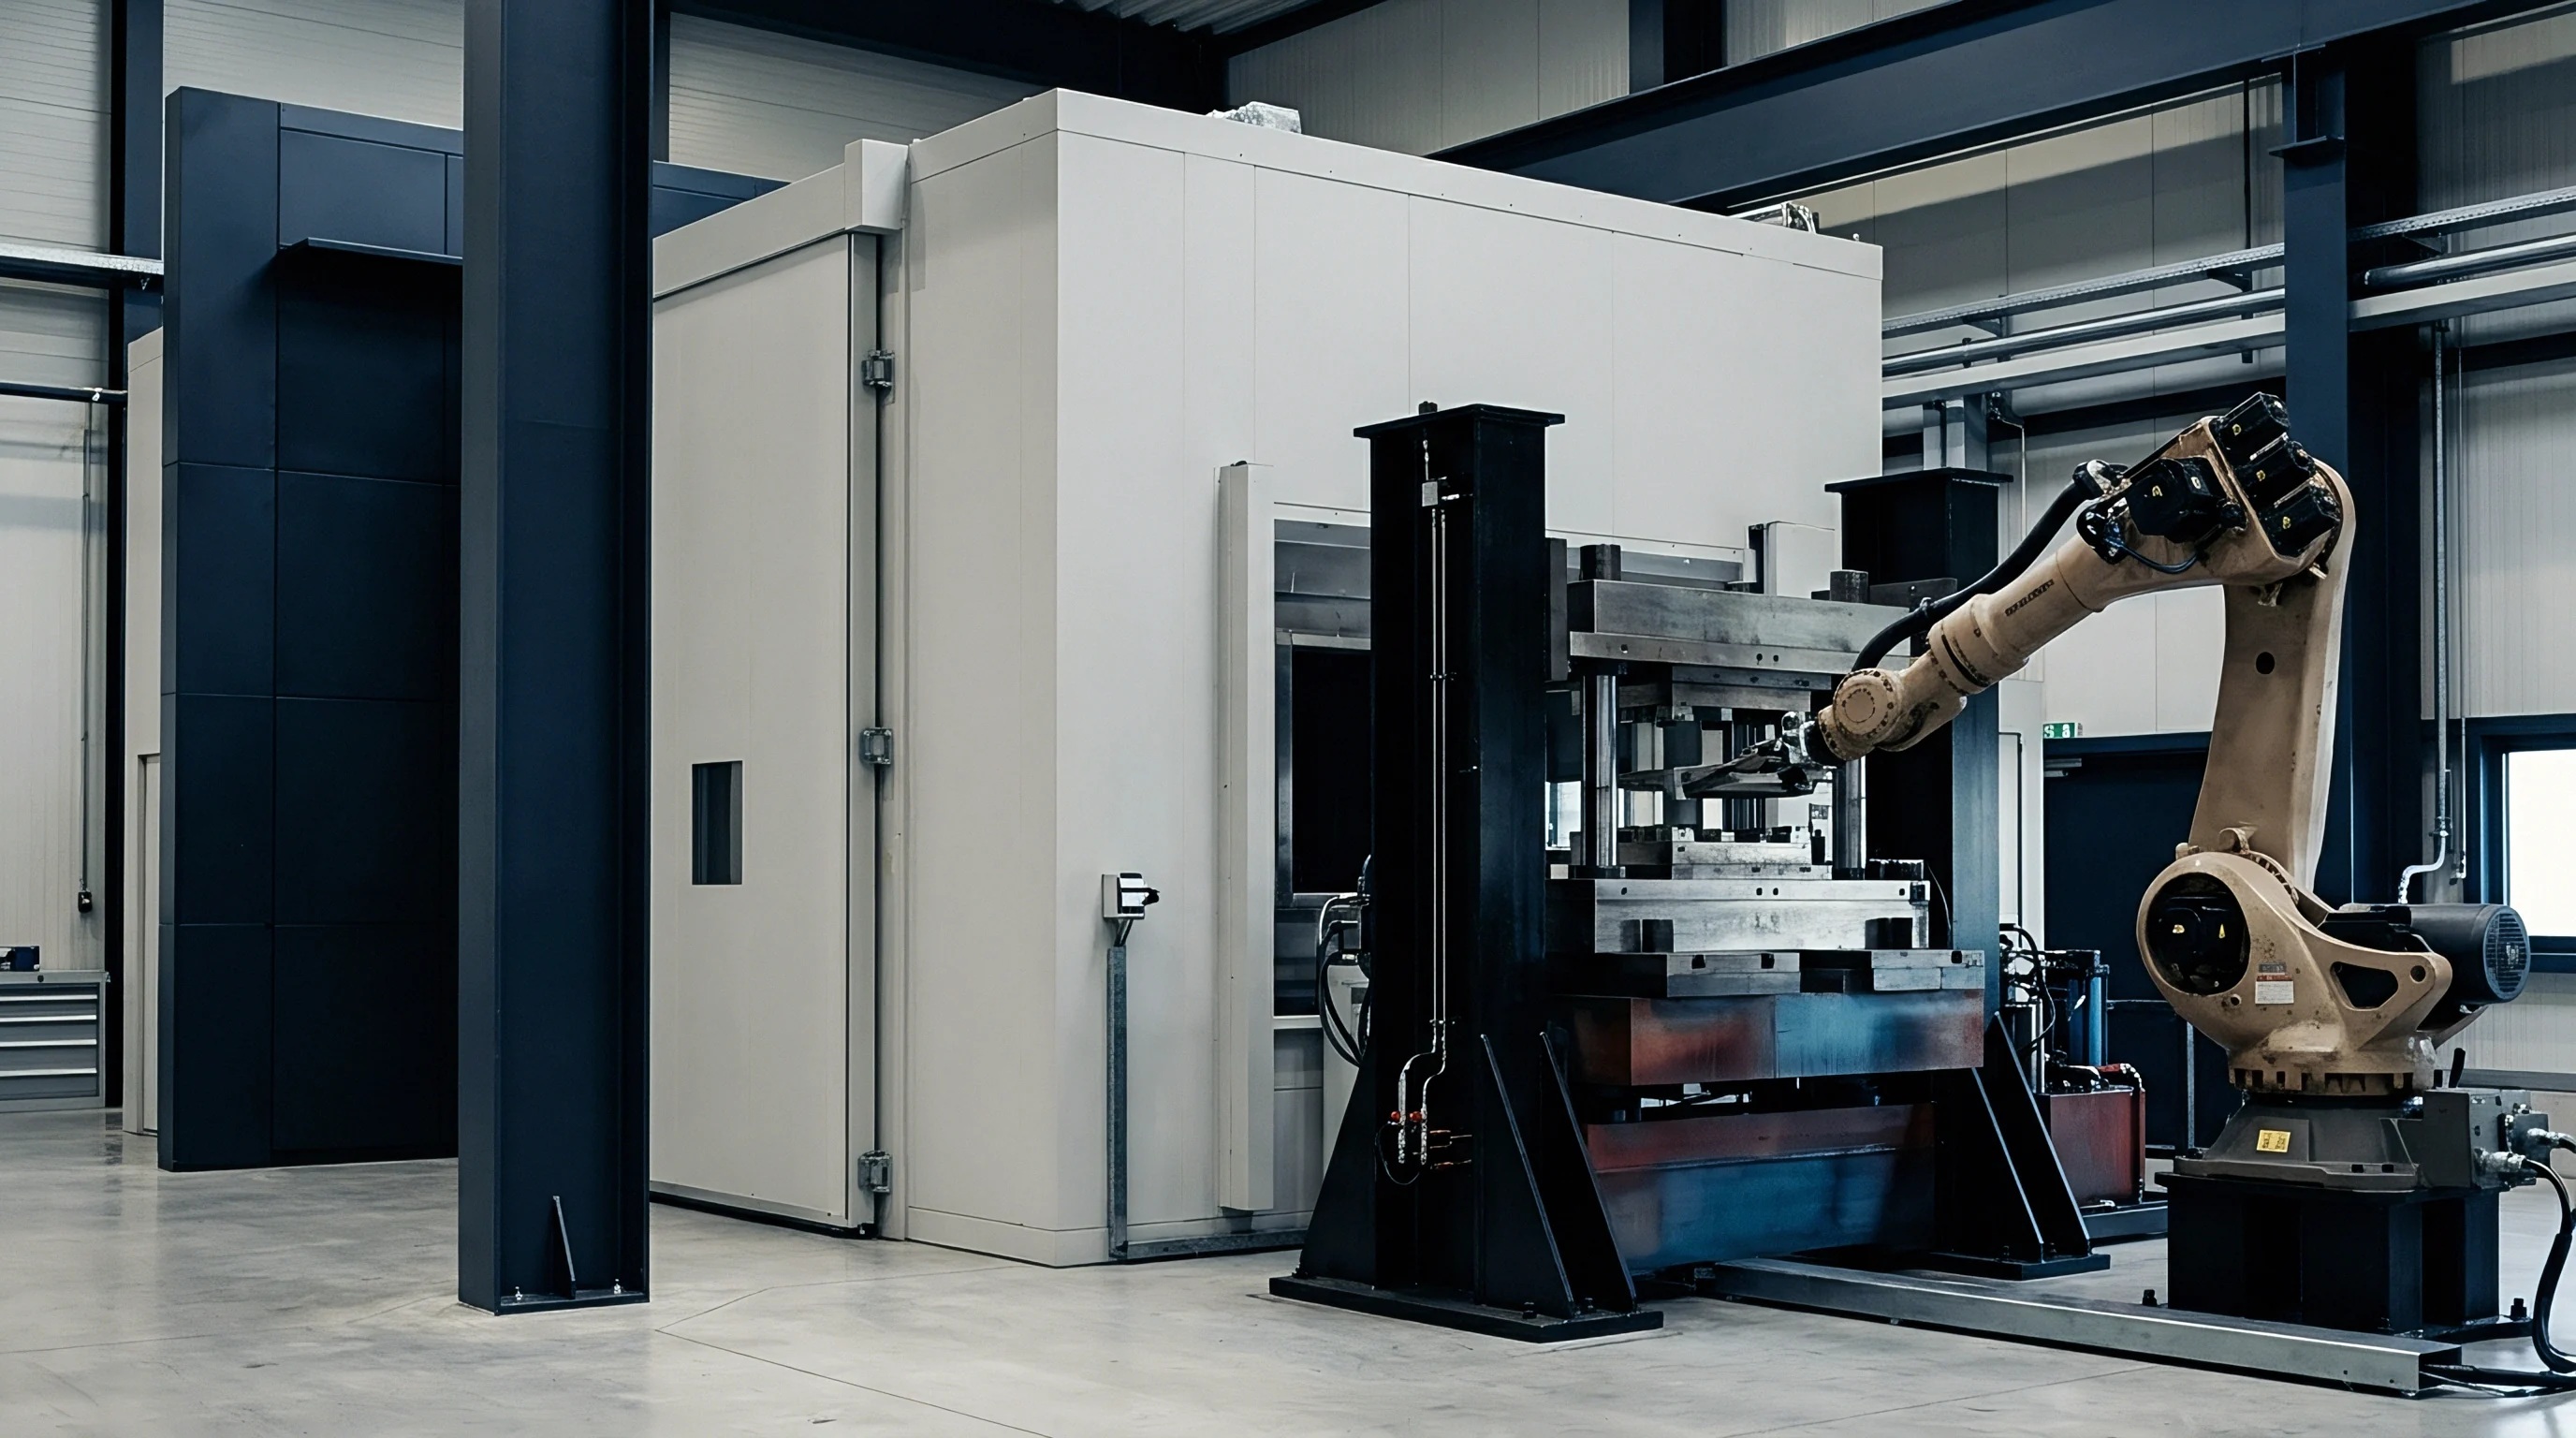
Specifying structural epoxy adhesives for launch vehicles, liquid hydrogen tanks, or quantum computing platforms involves substantial financial capital and tight safety margins. Relying on basic supplier datasheets based on room-temperature extrapolation or static isothermal testing introduces hidden structural risk. If a master curve underpredicts cryogenic elastic modulus by fifteen percent, actual thermal contraction stresses will exceed predicted bond line shear capacities, opening seam leaks or causing structural debonding during chill cycles.
The financial impact of a cryogenic joint failure extends far beyond replacing components. Aerospace launch delays incur facility stand-down penalties running into millions of dollars per day, while grounding a fleet to re-qualify an unverified bond line drains engineering resources and damages reputation. Investing in certified non-isothermal master curve construction during initial material qualification limits catastrophic downstream risk.
Testing Yield and Calibration Cost Tradeoffs
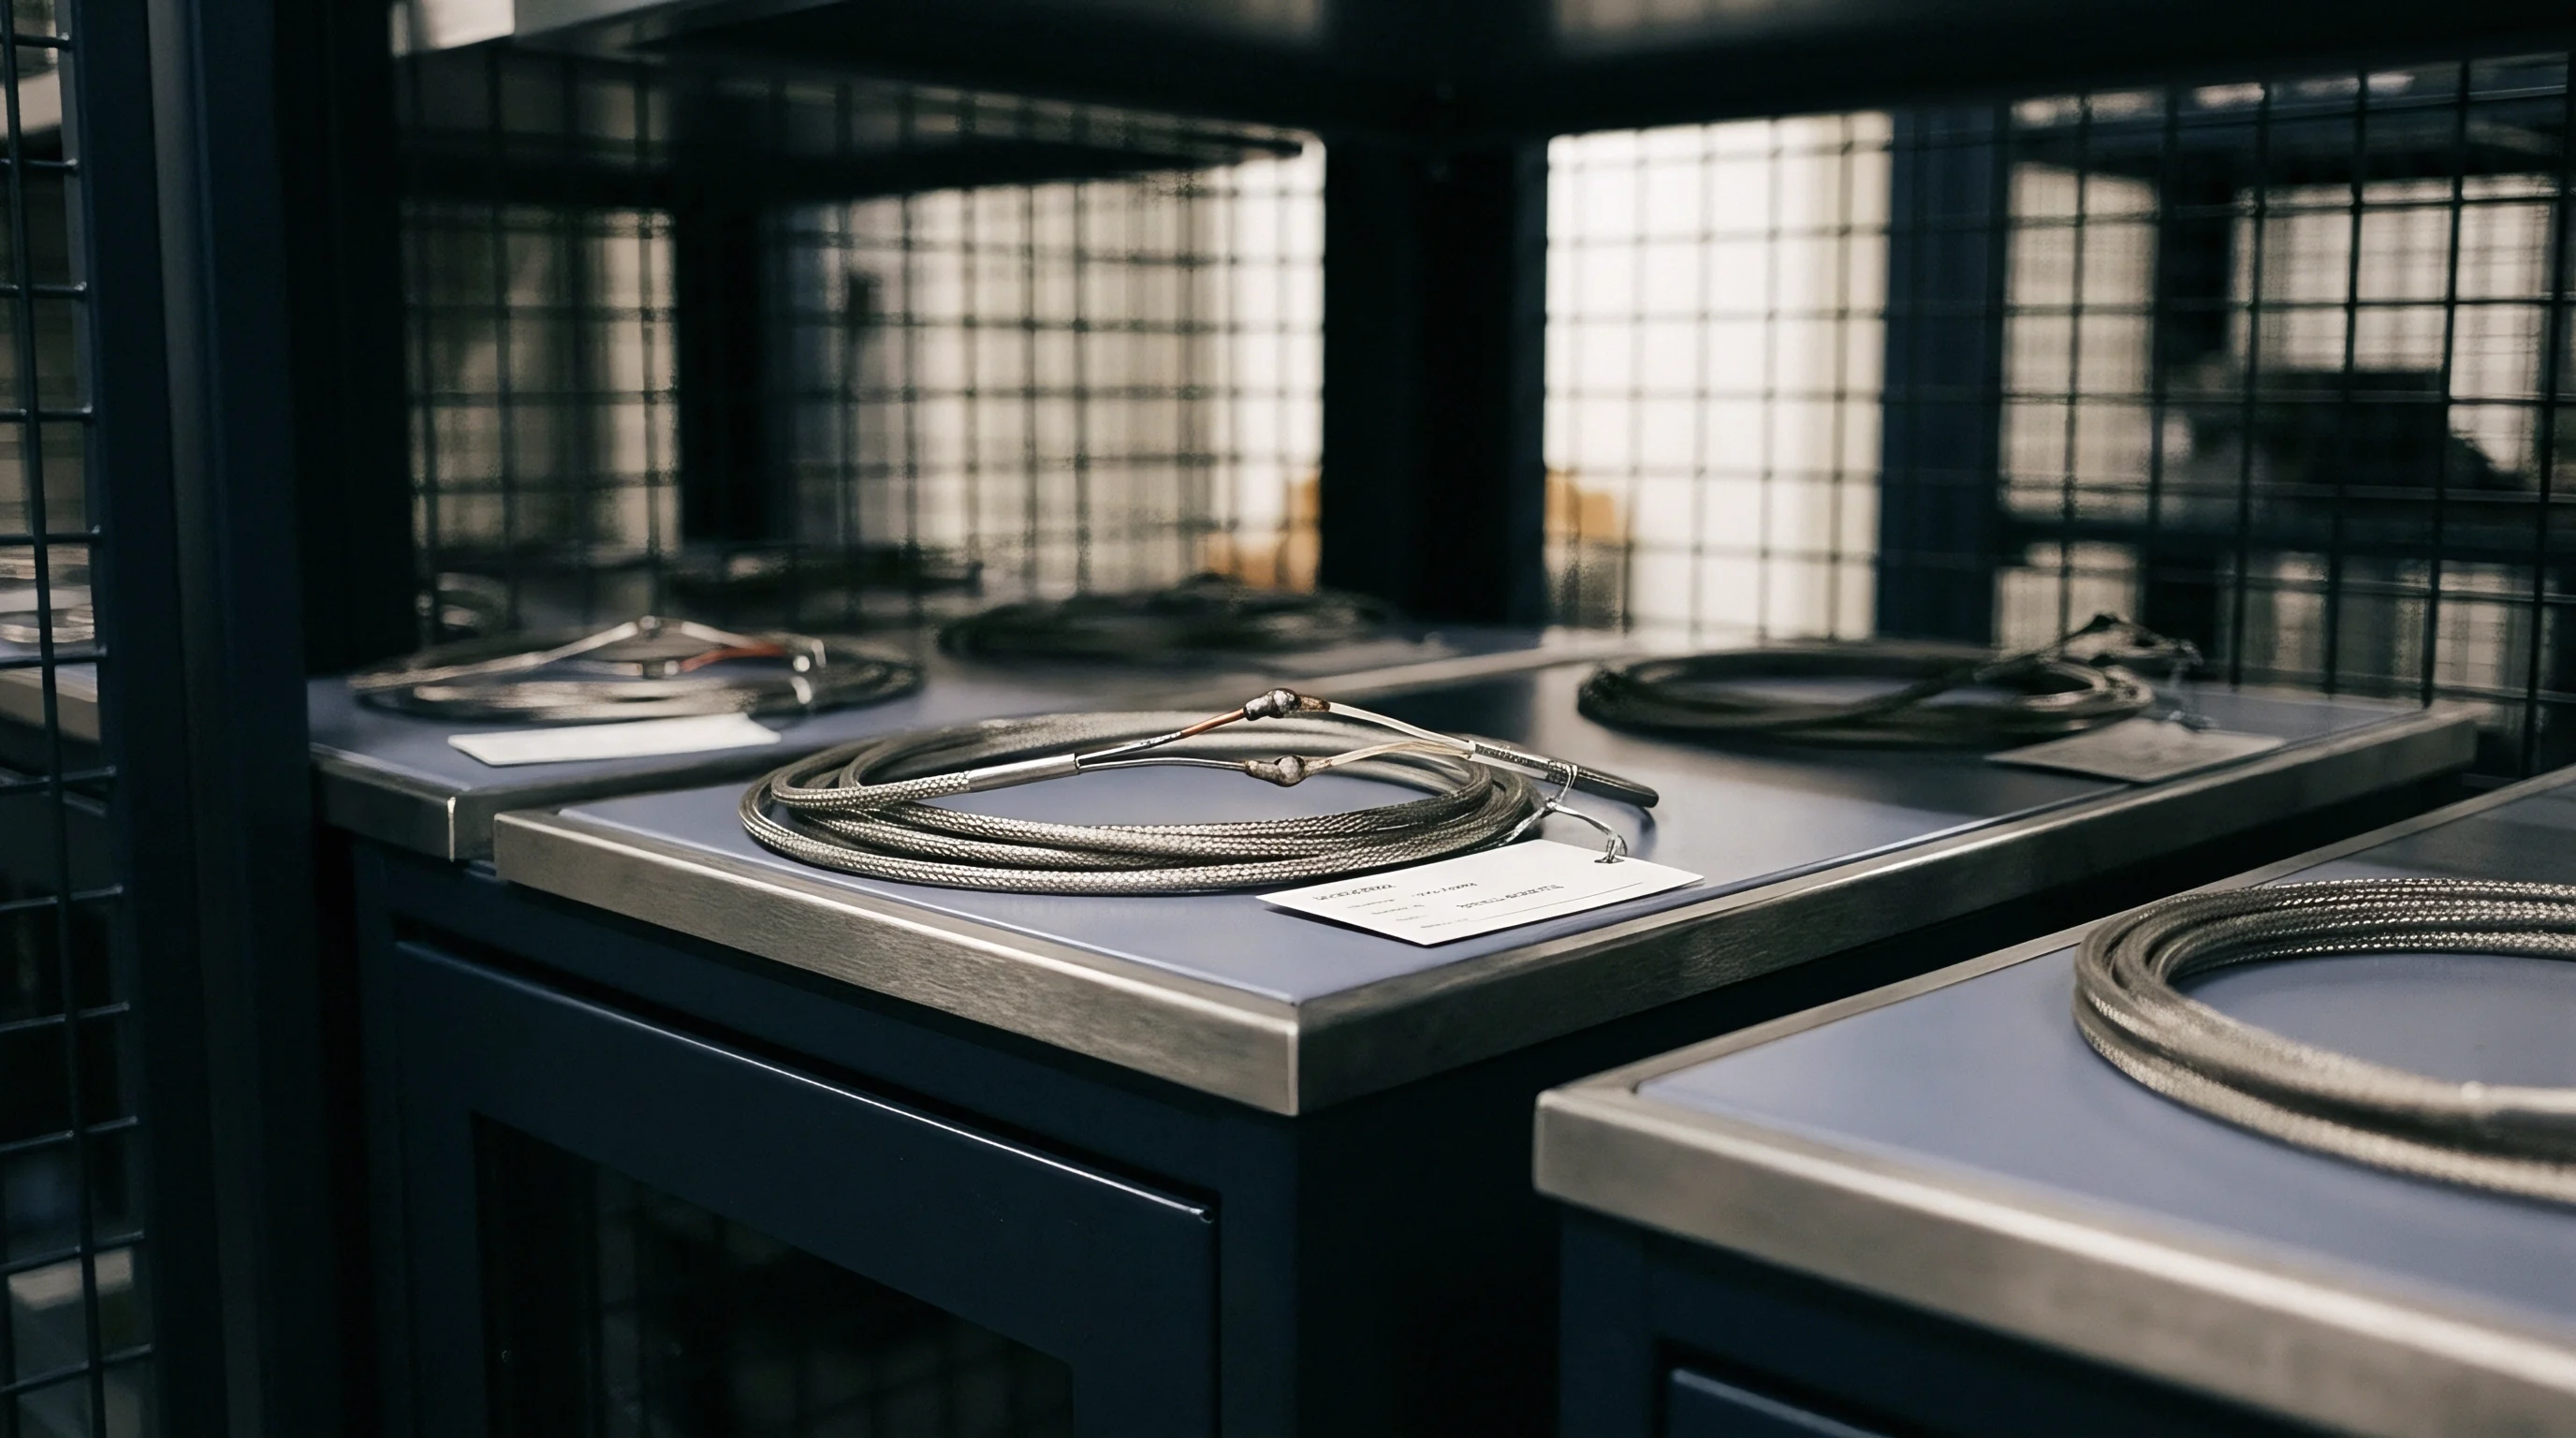
Selecting a material qualification protocol requires balancing testing budgets against acceptable uncertainty margins. Standard static isothermal DMA testing costs significantly less per batch, but yields low confidence when applied to dynamic cooling operations. Full non-isothermal master curve construction ~ incorporating thermal lag calibration and fictive temperature modeling ~ requires higher up-front laboratory expenditure, but reduces required safety factors in final joint design.
Refining safety factors allows structural engineers to reduce adhesive bond mass and substrate flange thickness. In aerospace applications, saving structural weight translates directly into increased commercial payload capacity. The up-front cost of rigorous cryogenic calibration and non-isothermal master curve construction yields a net positive return over the lifecycle of lightweight hardware.
| Qualification Approach | Initial Test Cost per Resin Lot | Uncertainty Margin on Cryogenic Modulus | Design Safety Factor Required | Financial Risk Exposure Rating |
|---|---|---|---|---|
| Standard Isothermal DMA Extrapolation | Low Base Level | Plus or Minus 28 Percent | 2.5 to 3.0 | High Warranty Exposure |
| Empirical Dynamic Ramp Sweep | Moderate Level | Plus or Minus 14 Percent | 1.8 to 2.2 | Moderate Risk Level |
| Full Non-Isothermal TNM Viscoelastic Master Curve | High Base Level | Plus or Minus 4 Percent | 1.2 to 1.4 | Minimal Residual Exposure |
Precise calibration data transforms uncertain material assumptions into predictable design parameters, establishing clear financial value for high-precision metrology in cryogenic structural engineering.